Views, and the + View menu
One table, many ways to look at it — each way is a view. Worksheet, Excel Sheet, Form, Bar & Line, Data Pivot, Stack, Funnel, Gauge, Metric, Text, Selectors and Advanced Views. How to add, edit and delete one, plus a one-line guide to picking a type.
What a view is
Open a table and the first tab after Workflow is the table itself. Every tab after that is a view of it. A view does not copy data — it is only "look at this table this way". Delete a view and not one row is lost.
Add, edit, delete
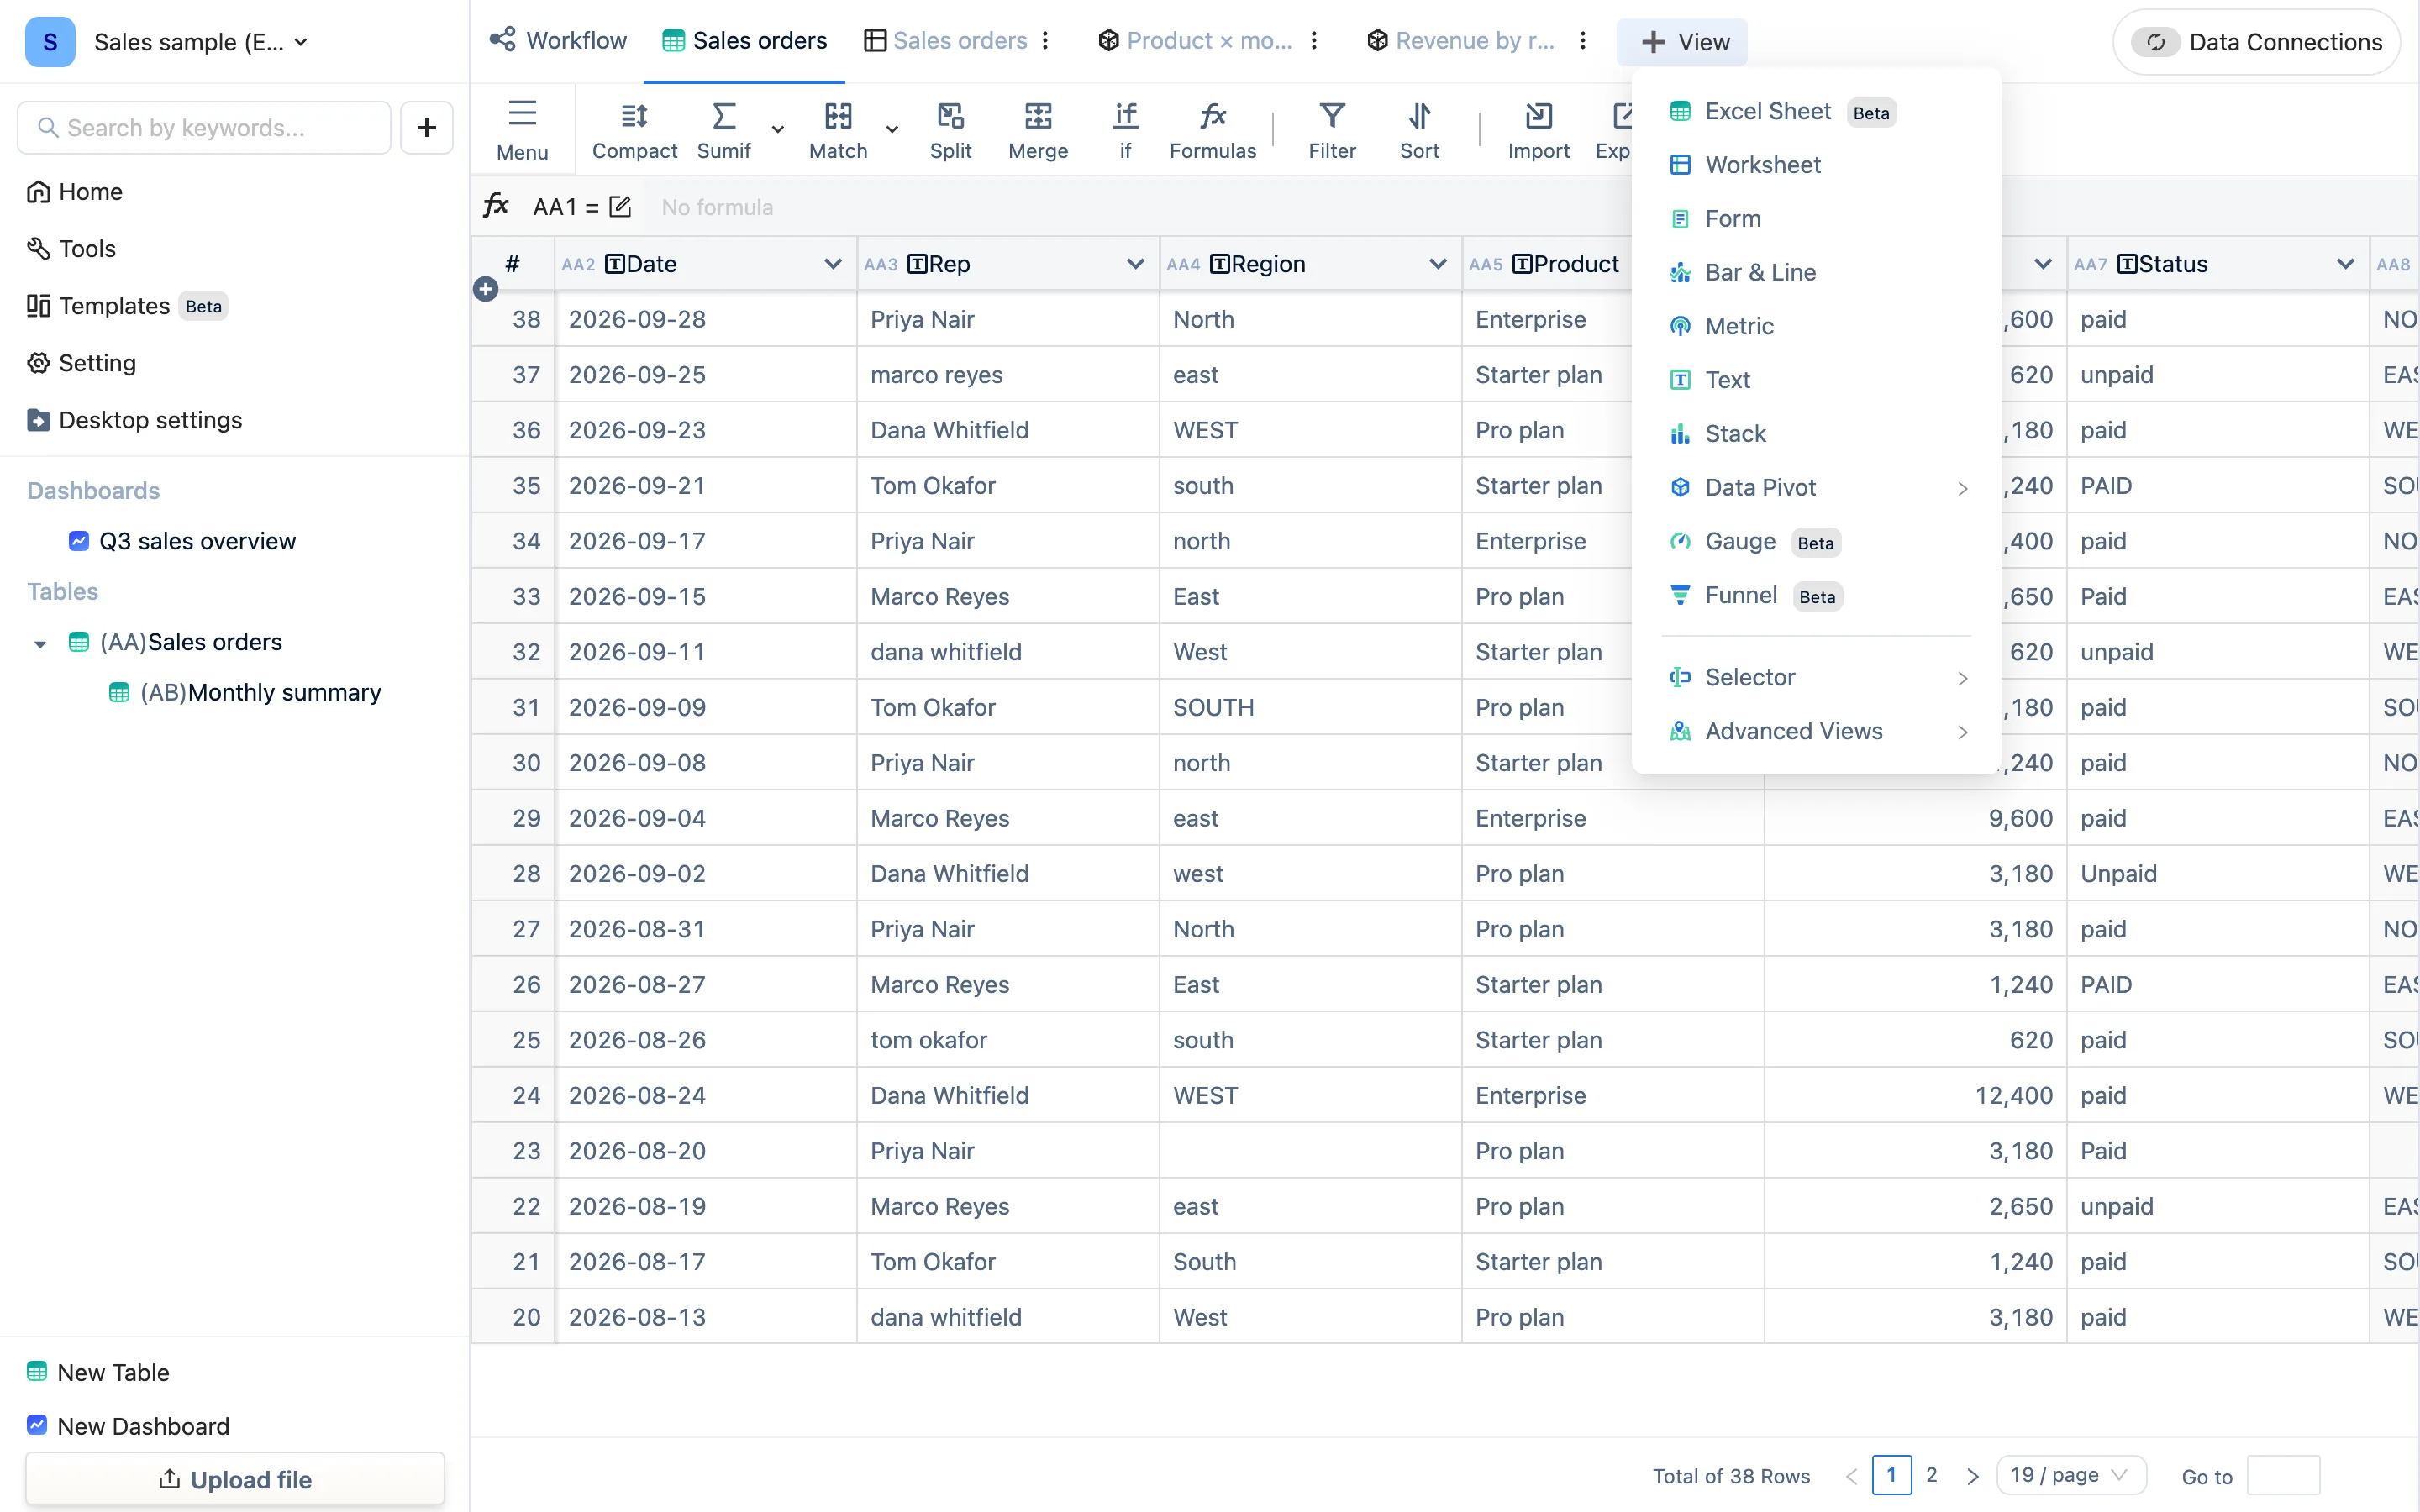
- Add — + View at the right of the tab bar, then pick a type. Three entries open a submenu: Data Pivot (Pivot Report, Bar Chart, Line Chart, Pie Chart), Selector (Dropdown, Radio, Checkbox) and Advanced Views (Time Series, Signal Map).
- Edit — switch to the view and press Edit mode in the toolbar. A configuration panel appears on the right with three tabs: data, style, actions. Press Exit edit mode when you are done. Chart views let you set a title, the data columns, a row cap, sorting and filters.
- Rename / delete — the ⋮ on the view's own tab.
Every view carries its own filter and sort, independent of the others; see View filters, sorting and embedding.
Picking a type
| You want | Use |
|---|---|
| The same rows with a different column set, order or filter | Worksheet |
| To type into an Excel-like grid | Excel Sheet (Beta) |
| To enter records one at a time | Form |
| To compare sizes or see a trend by month or category | Bar & Line |
| To cross two dimensions and total them, or see shares | Data Pivot — report, bar, line, pie |
| Composition, conversion, attainment, the state of one number | Stack, Funnel, Gauge, Metric, Signal Map, Time Series |
| A paragraph of explanation, or a control that filters a dashboard | Text, selectors and inputs |
Views and dashboards
A view can go straight onto a dashboard (dashboard editor → pick a table → Select exsiting views), or you can create a chart inside the dashboard — which quietly creates a view on that table too, just from the other end. Both sides see the same configuration.