The Workflow graph
One picture of which column feeds which. Use it to trace where a number came from, to check what depends on a column before changing it, and to understand a template someone else built.
Where it is
Open any table and click Workflow, the leftmost tab in the tab bar.
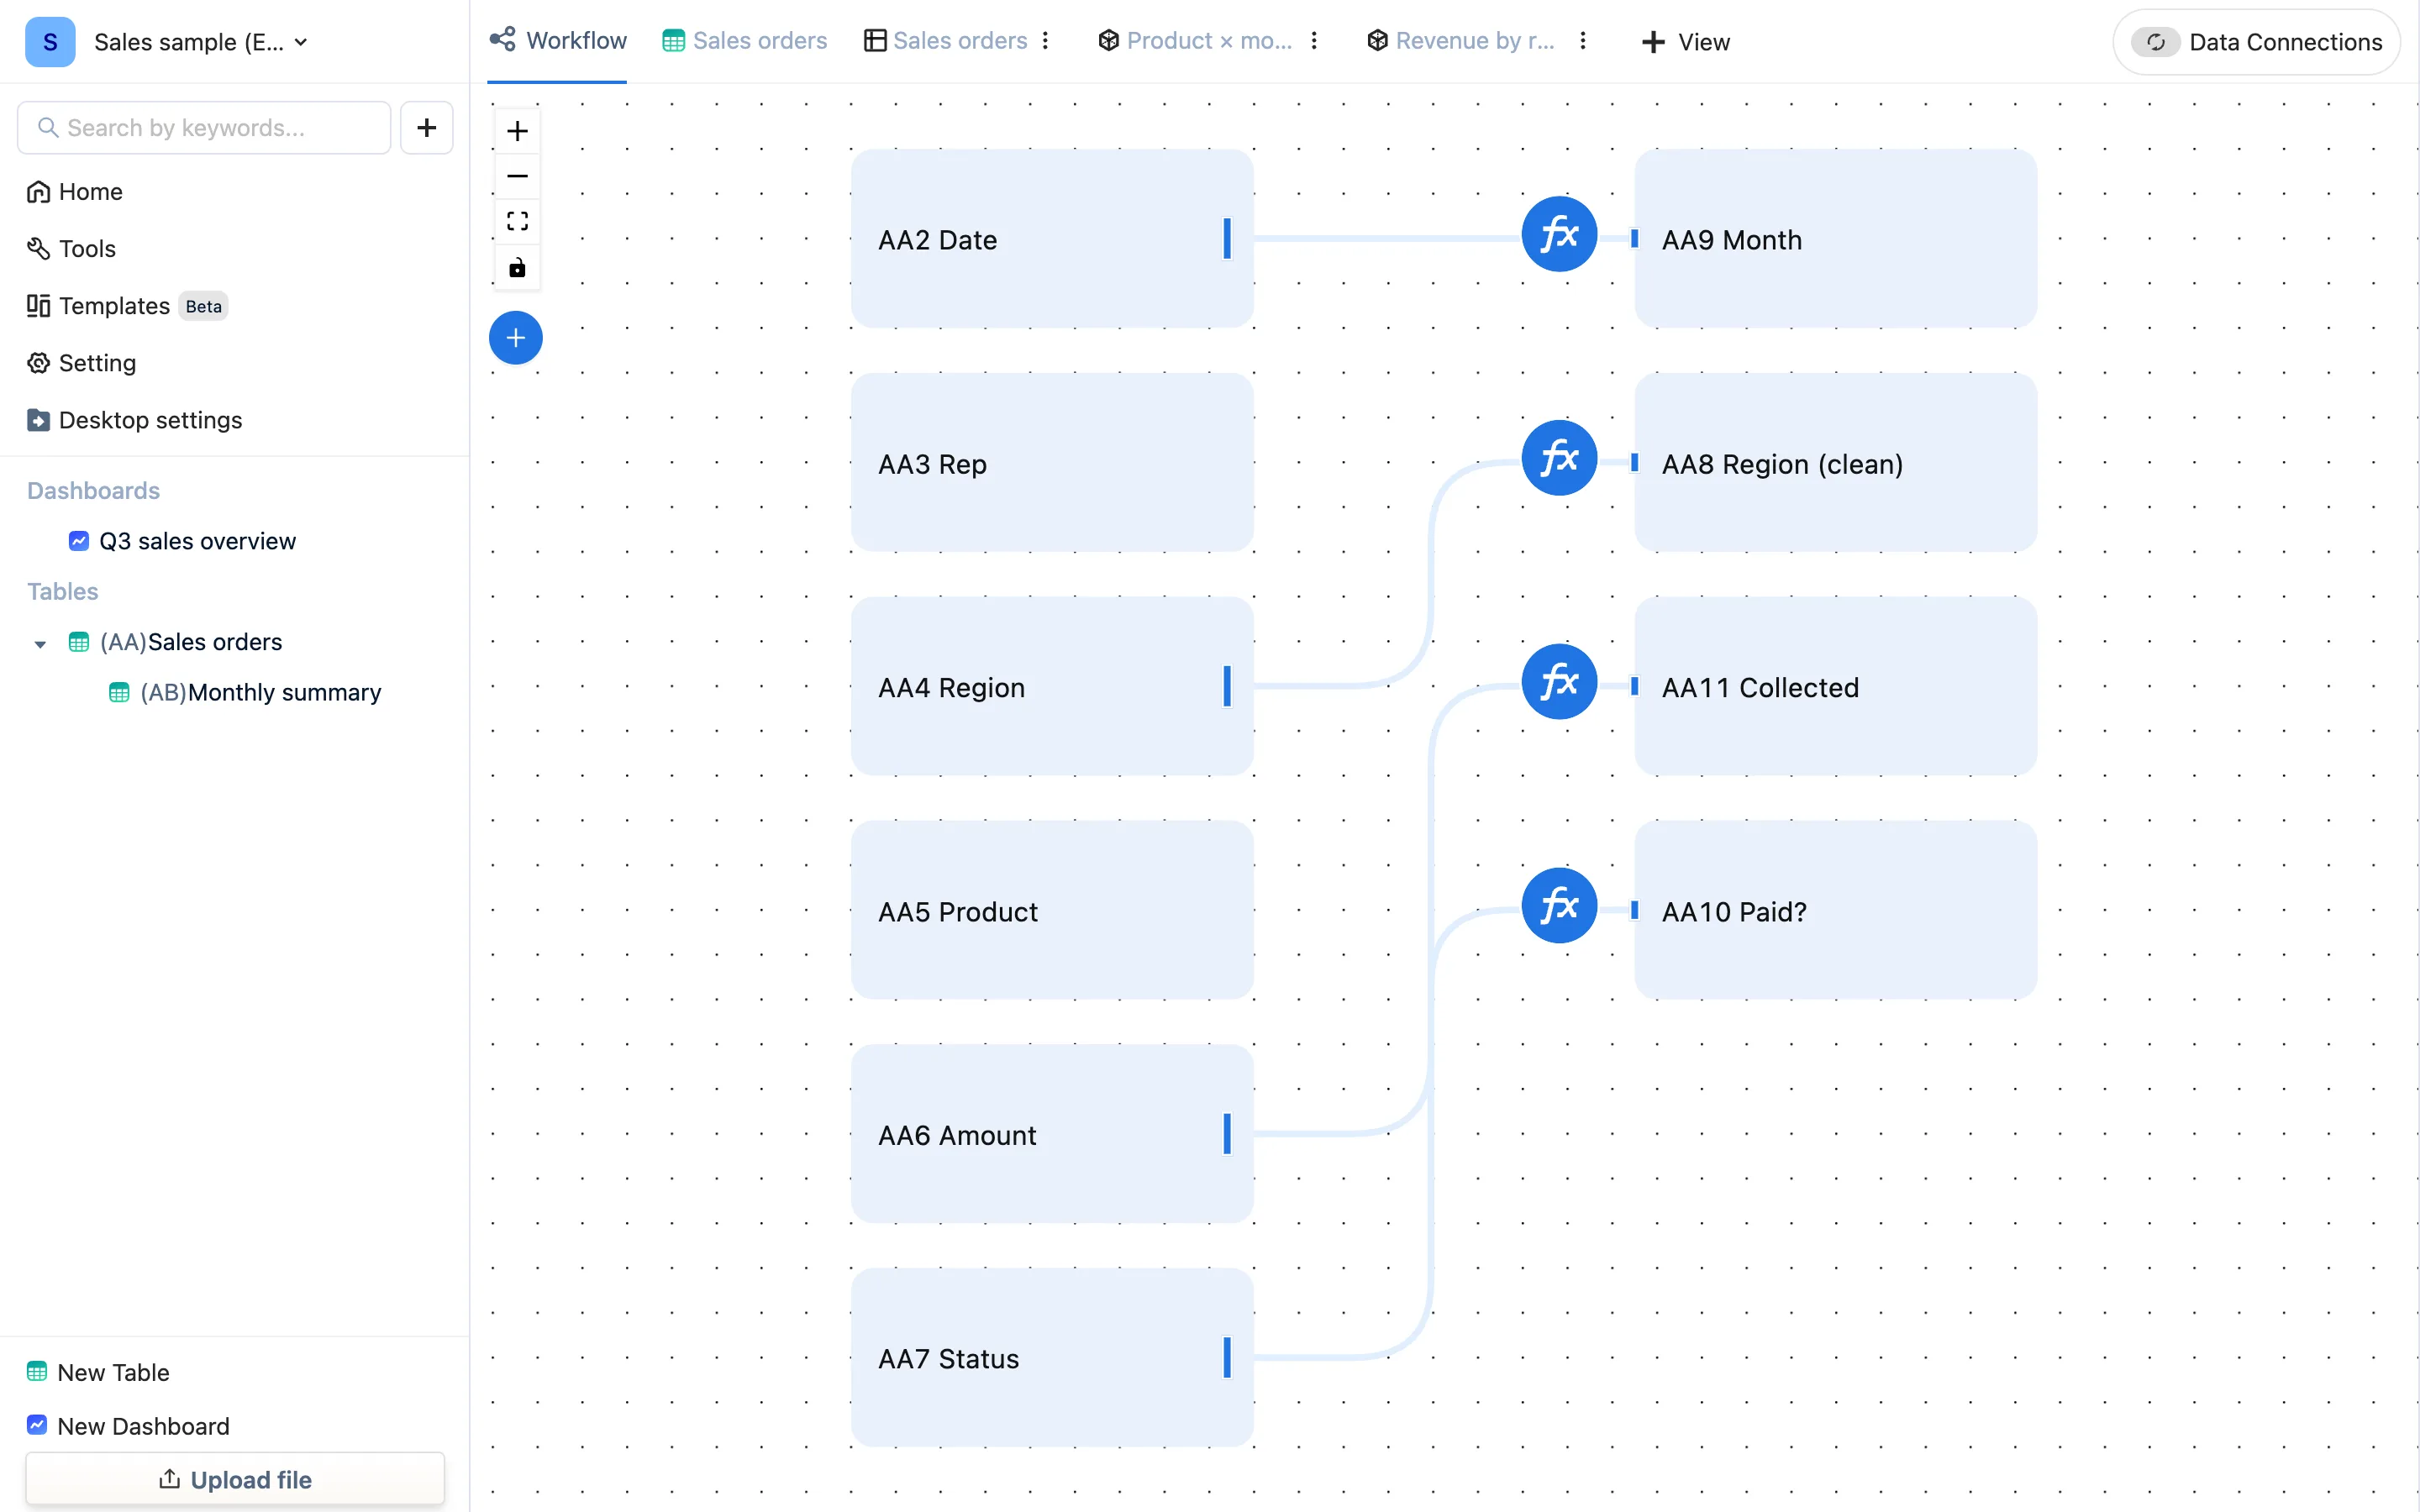
- On the left are the raw columns (those without formulas); on the right, the formula columns.
- Each line is one reference, drawn from the column being read to the formula that reads it.
AA11 Collectedconnects to bothAA7 StatusandAA6 Amount, because its formula uses both. - Cross-table references are drawn too: the graph of summary table
ABshows columns fromAA. - Click a node to jump to that column's formula.
Three things it is for
- Tracing a number. Someone asks how "Collected" is calculated — follow the lines left two steps and you have the answer, without opening formulas one at a time.
- Looking before you change something. About to delete or rename a column? See how many lines run out of it to the right. Renaming is safe (references are by code); deleting breaks every formula downstream.
- Understanding a template. After installing someone else's template or a bundled sample, read the graph first — much faster than clicking through every column.
Against the sidebar tree
The indent in the sidebar shows dependencies between tables (AB references AA). The Workflow graph shows dependencies between columns. The first tells you the blast radius; the second tells you the exact path.