Summarize — grouped totals
Group by one column and aggregate others into a new table. Ten aggregate operations, and why the result is a live table rather than a snapshot.
The panel
Sumif in the toolbar (the panel is titled Summarize — aggregate table data and produce a new table), or Summarize Table on the Tools page:
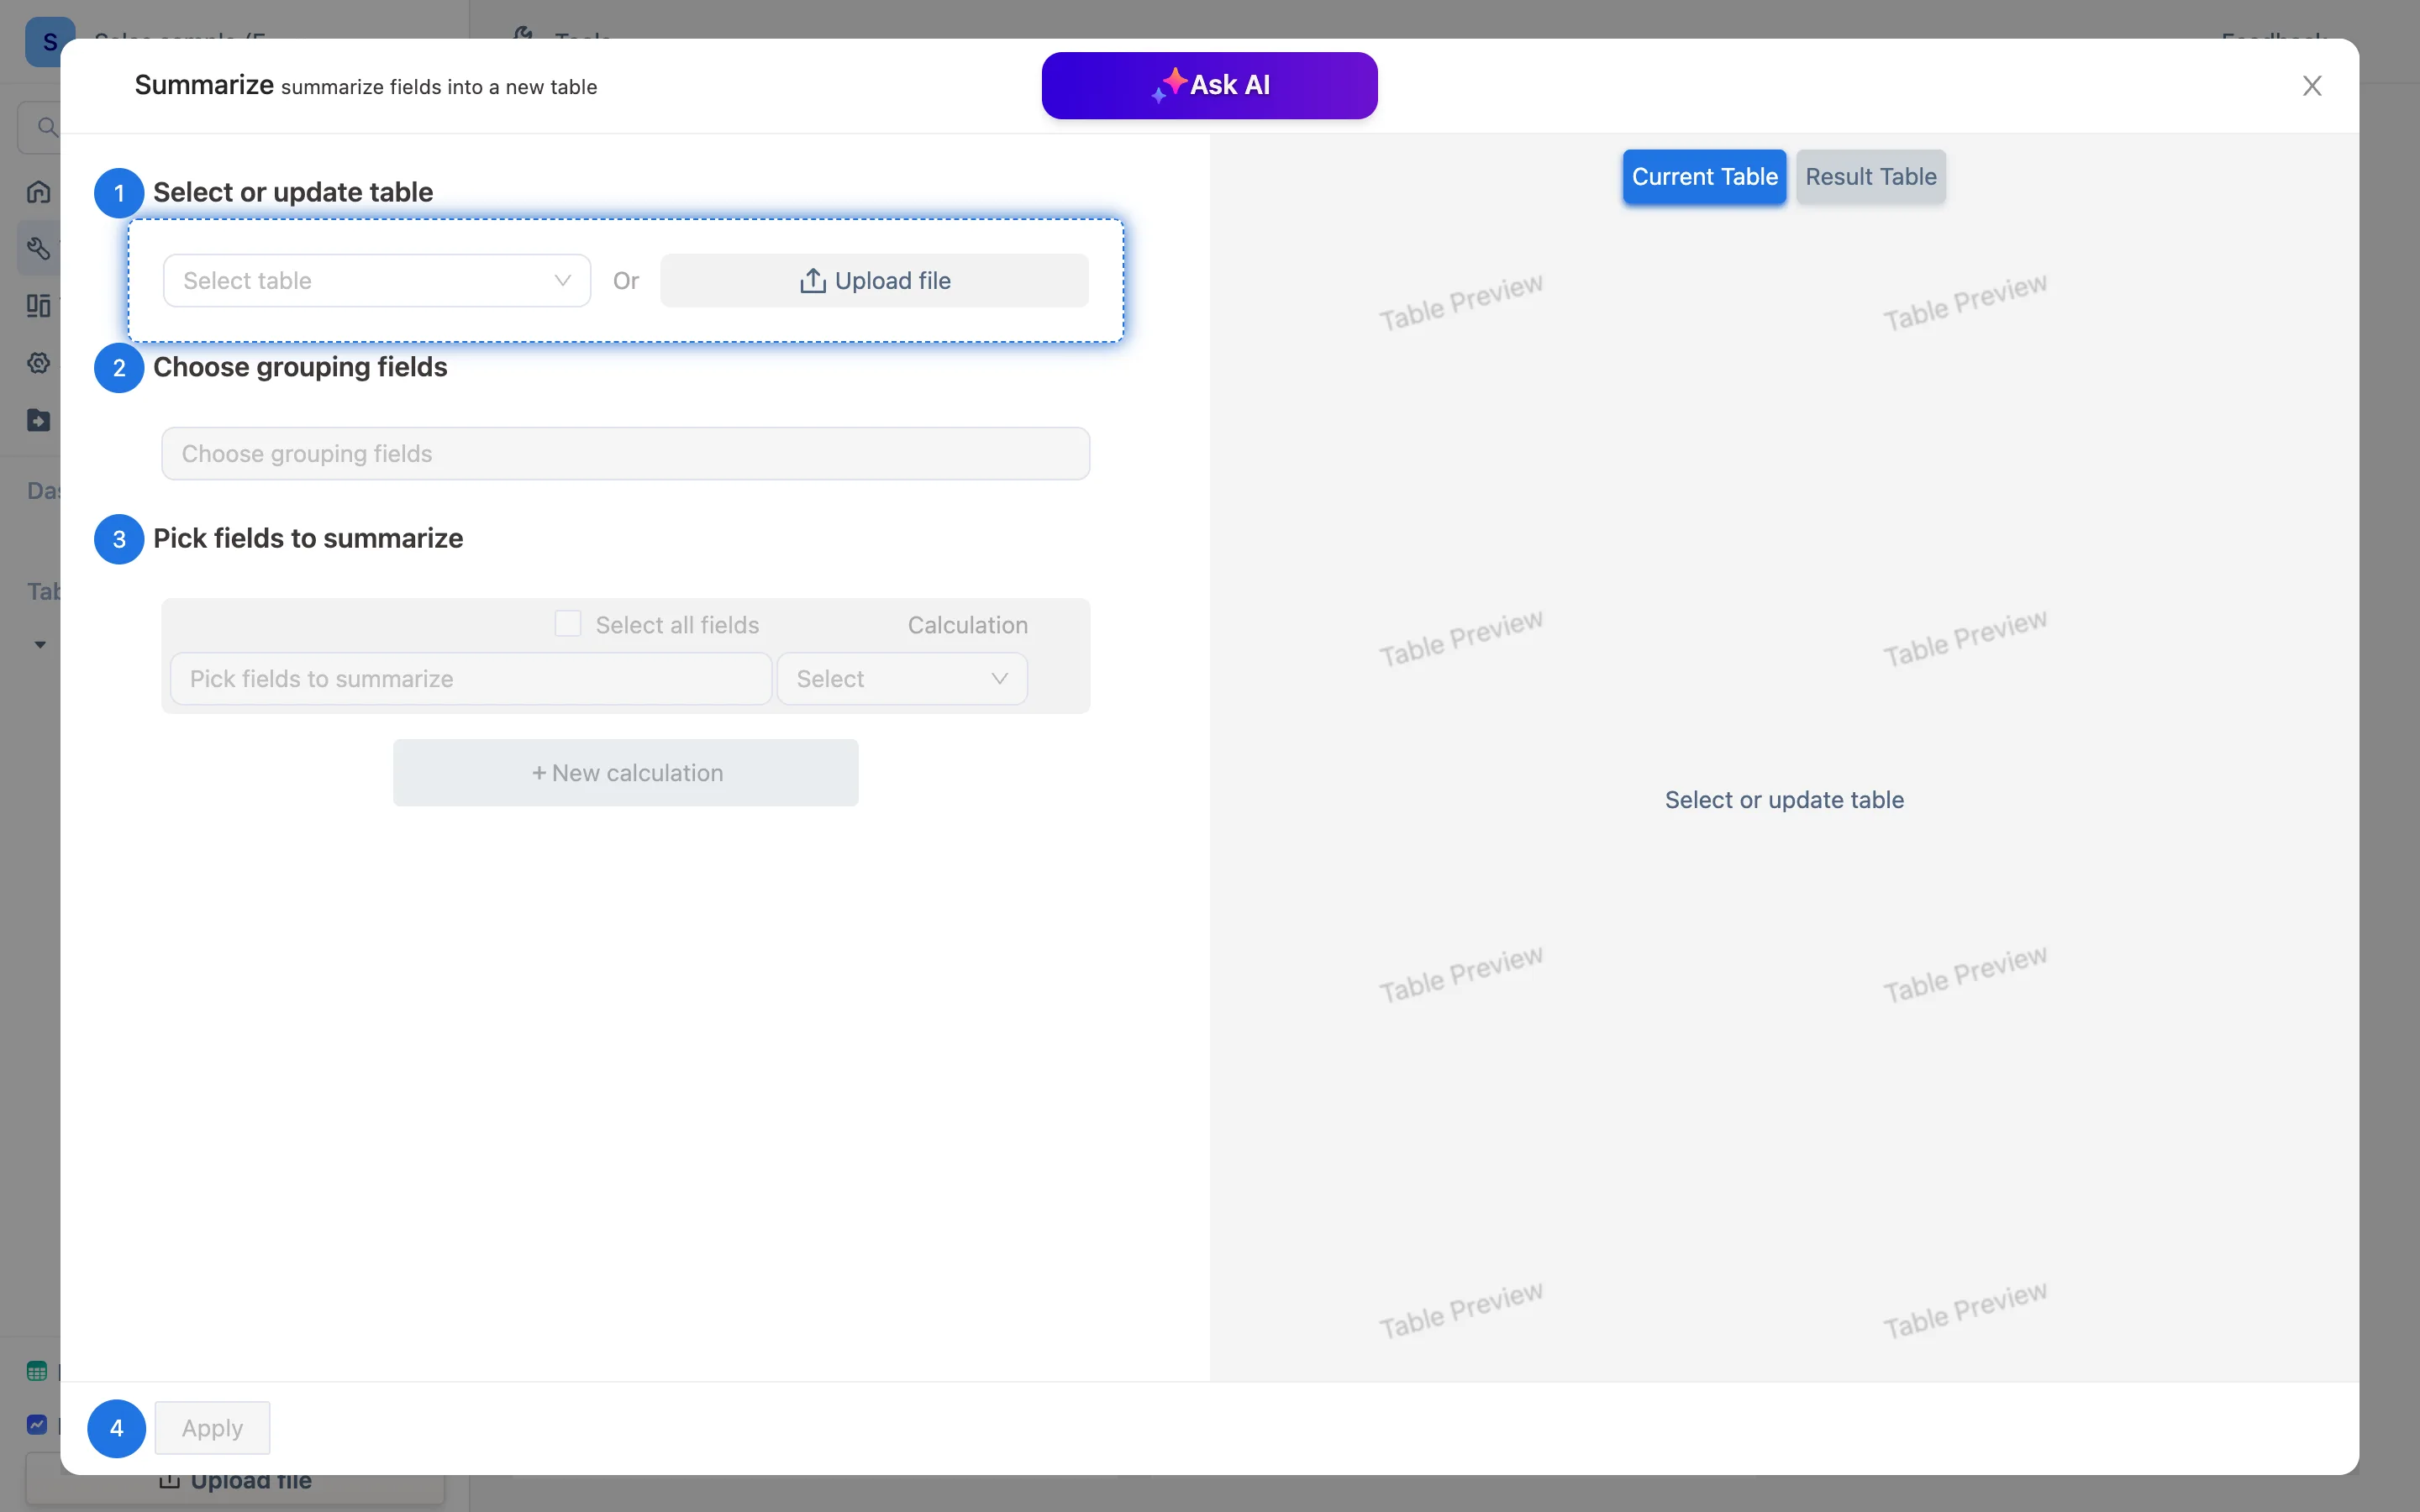
The panel is headed Summarize — summarize fields into a new table, with four numbered steps:
- Select or update table — the current table by default.
- Choose grouping fields — month, department, class, product. Several fields can be combined into one grouping.
- Pick fields to summarize — each row takes a field and a Calculation; + New calculation adds another. Select all fields applies the same calculation to every numeric field.
- Apply. A new table is created and opened.
The right-hand pane toggles between Current Table and Result Table, so you can see what you are about to get before applying.
Ask AI at the top reads the headers and proposes several plausible groupings and aggregates; pick one and the panel fills in.
The aggregates
| Operation | Gives | Function |
|---|---|---|
| Sum | The group total | sumif |
| Count | How many rows in the group | countif |
| Distinct count | How many different values (how many customers, how many products) | distinctcountif |
| Max / Min | The group's largest and smallest | maxif / minif |
| Average | The group mean | average |
| Median, lower quartile, upper quartile | Where the distribution sits | median / lowerquartile / upperquartile |
| Standard deviation | How spread out it is | stdevsif |
| Latest | The newest row's value in that group — works on text too, e.g. each customer's most recent contact | — |
The result is a live table
The summary's first column holds the grouping values; every column after it is an aggregate formula. Add rows or change numbers in the source and the summary updates; a new grouping value in the source (a new month, a new department) adds a row here. You can keep adding columns to it (Average order = Booked / Orders), reference it from a third table, put it on a dashboard, and export it. The mechanism is explained in growing a summary table.
Examples
| What you want | Group by | Aggregate |
|---|---|---|
| Revenue and order count per month | Month | Amount · Sum, Order number · Count |
| Headcount and average salary per department | Department | Employee id · Count, Salary · Average |
| Class average, top mark, number passing | Class | Score · Average, Score · Max, Passed? · Count (make a "Passed?" column with if first) |
| Each customer's most recent contact | Customer | Contact · Latest |
Against a pivot view
A pivot view is for looking; Summarize produces a table. When you need to add custom columns to the result, reference it, or export it, use Summarize. For a quick glance at a distribution, use a pivot view.