Tables, views and dashboards — three layers
A table holds the data, a view is one way of looking at that same data, a dashboard puts views from several tables on one canvas. Each layer does one job, and there is only ever one copy of the data.
One job each
| Layer | Holds | Where it lives |
|---|---|---|
| Table | The data itself: columns, rows, formulas | Tables in the sidebar |
| View | One way of looking at that table — worksheet, pivot, bar chart, pie… A view does not copy the data | The tab bar above the table |
| Dashboard | A canvas holding views from several tables, plus text and inputs | Dashboards in the sidebar |
Views: the same data, seen differently
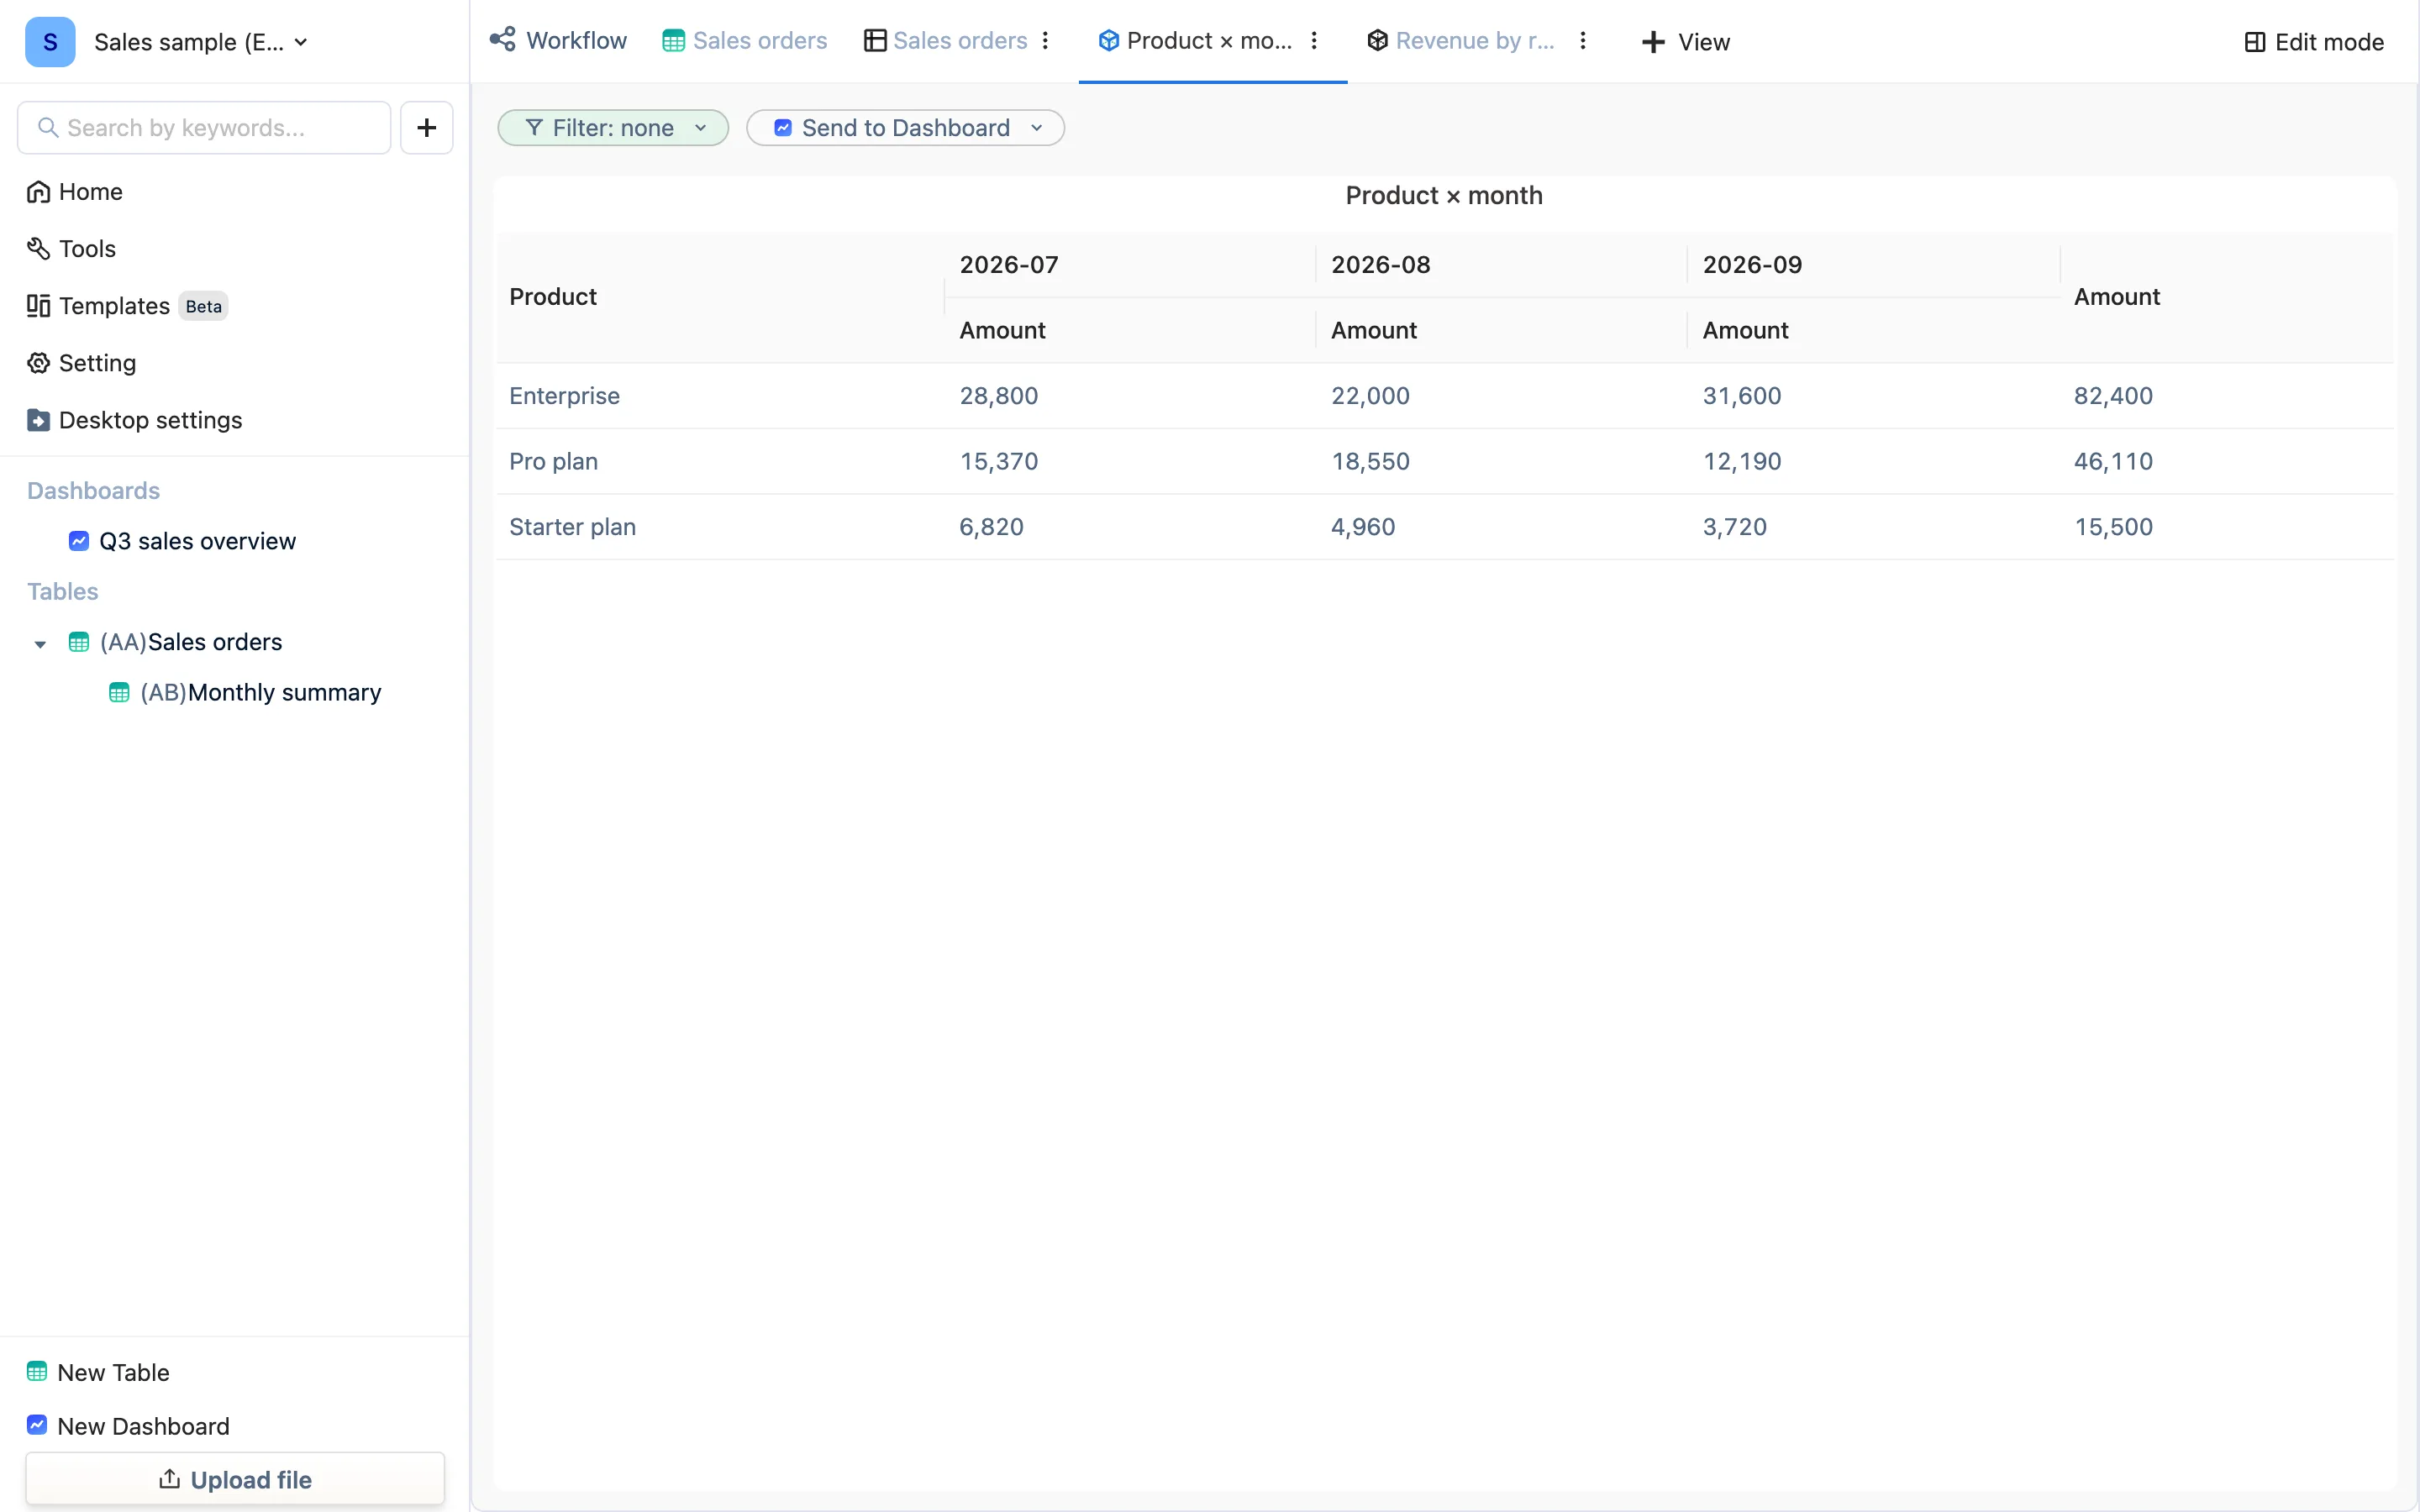
Open a table and the first tab is the table itself (a worksheet view); every tab after it is a view you added. + View adds:
- Worksheet (its own visible columns, filter and sort — "only East, sorted by amount descending")
- Excel view (Beta): see and edit in an Excel-like grid
- Form: an interface for entering one record at a time
- Bar / line, stacked, funnel, gauge, metric, time curve
- Pivot: report, pivot bar, pivot line, pivot pie
- Text, selectors (dropdown / radio / multi-select), advanced views
Each view keeps its own filter and sort, affecting neither the others nor the table. Delete a view and not one row of data goes with it.
To show a colleague "only the East orders", do not duplicate the table — add a worksheet view with a filter of Region = East. It follows the detail table as it updates; a duplicate never would.
Dashboards: views placed side by side
A dashboard stores no data. It references views: the booked-vs-collected bar chart comes from Monthly summary, the revenue pie from Sales orders, the pivot in between from Sales orders. So:
- Change the data in a table and every dashboard component referencing it changes with it.
- One view can appear on several dashboards.
- Besides data views, a dashboard can hold text, an embedded page, a text input, a dropdown and a date picker — those are for interaction: pick a month and every chart filters to it (a dashboard parameter). The Dashboards chapter covers it.
The free version includes one dashboard; the paid version is unlimited.
Common shapes
- One detail table + one summary + one dashboard. The detail table imports and cleans the raw data; the summary aggregates it by month / person / category with cross-table formulas; the dashboard shows charts from the summary and a worksheet view of the detail. This is exactly how the sample workspace is built.
- Two detail tables looking each other up. Stock movements and a parts list, with Match pulling the running balance into the list.
- One table and a few views. For small data there is no need for a summary table at all — add pivot and chart views directly.
The next page is about how tables link to each other.