Linked tables — how tables connect
There is no separate "relationship" setting. Tables connect through formula references, in three shapes, and that is what makes a summary table grow out of a detail table and a dashboard update by itself.
The only way tables connect
There is no "link" or "relationship" object here. Tables connect through formula references. Write AA9 in a column of table AB and AB now depends on AA. Three common shapes:
| Shape | Example | What you get |
|---|---|---|
| Reference a column directly | AB1 = AA9 |
AB's first column takes the distinct values of AA9, one per row — the starting point for growing a summary table |
| Conditional aggregate | AB2 = SUMIF(AA6, AB1 = AA9) |
Sums AA6 over the rows where AA9 equals this row's AB1. COUNTIF, MAXIF, MINIF, AVERAGE work the same way |
| Match and pull | Written by the Match panel | Pulls a few columns across from another table on a shared key (order number, part number) — the job VLOOKUP does |
A formula written by a panel is no different from one you typed; both are the shapes above.
Growing a summary table
This is the pattern worth learning. Create an empty table and put AA9 in its first column (referencing the detail table's Month column) — the table immediately has one row per month. Add SUMIF and COUNTIF columns and a monthly summary is finished. It is a real table: you can add columns, chart it, reference it from a third table, and put it on a dashboard.
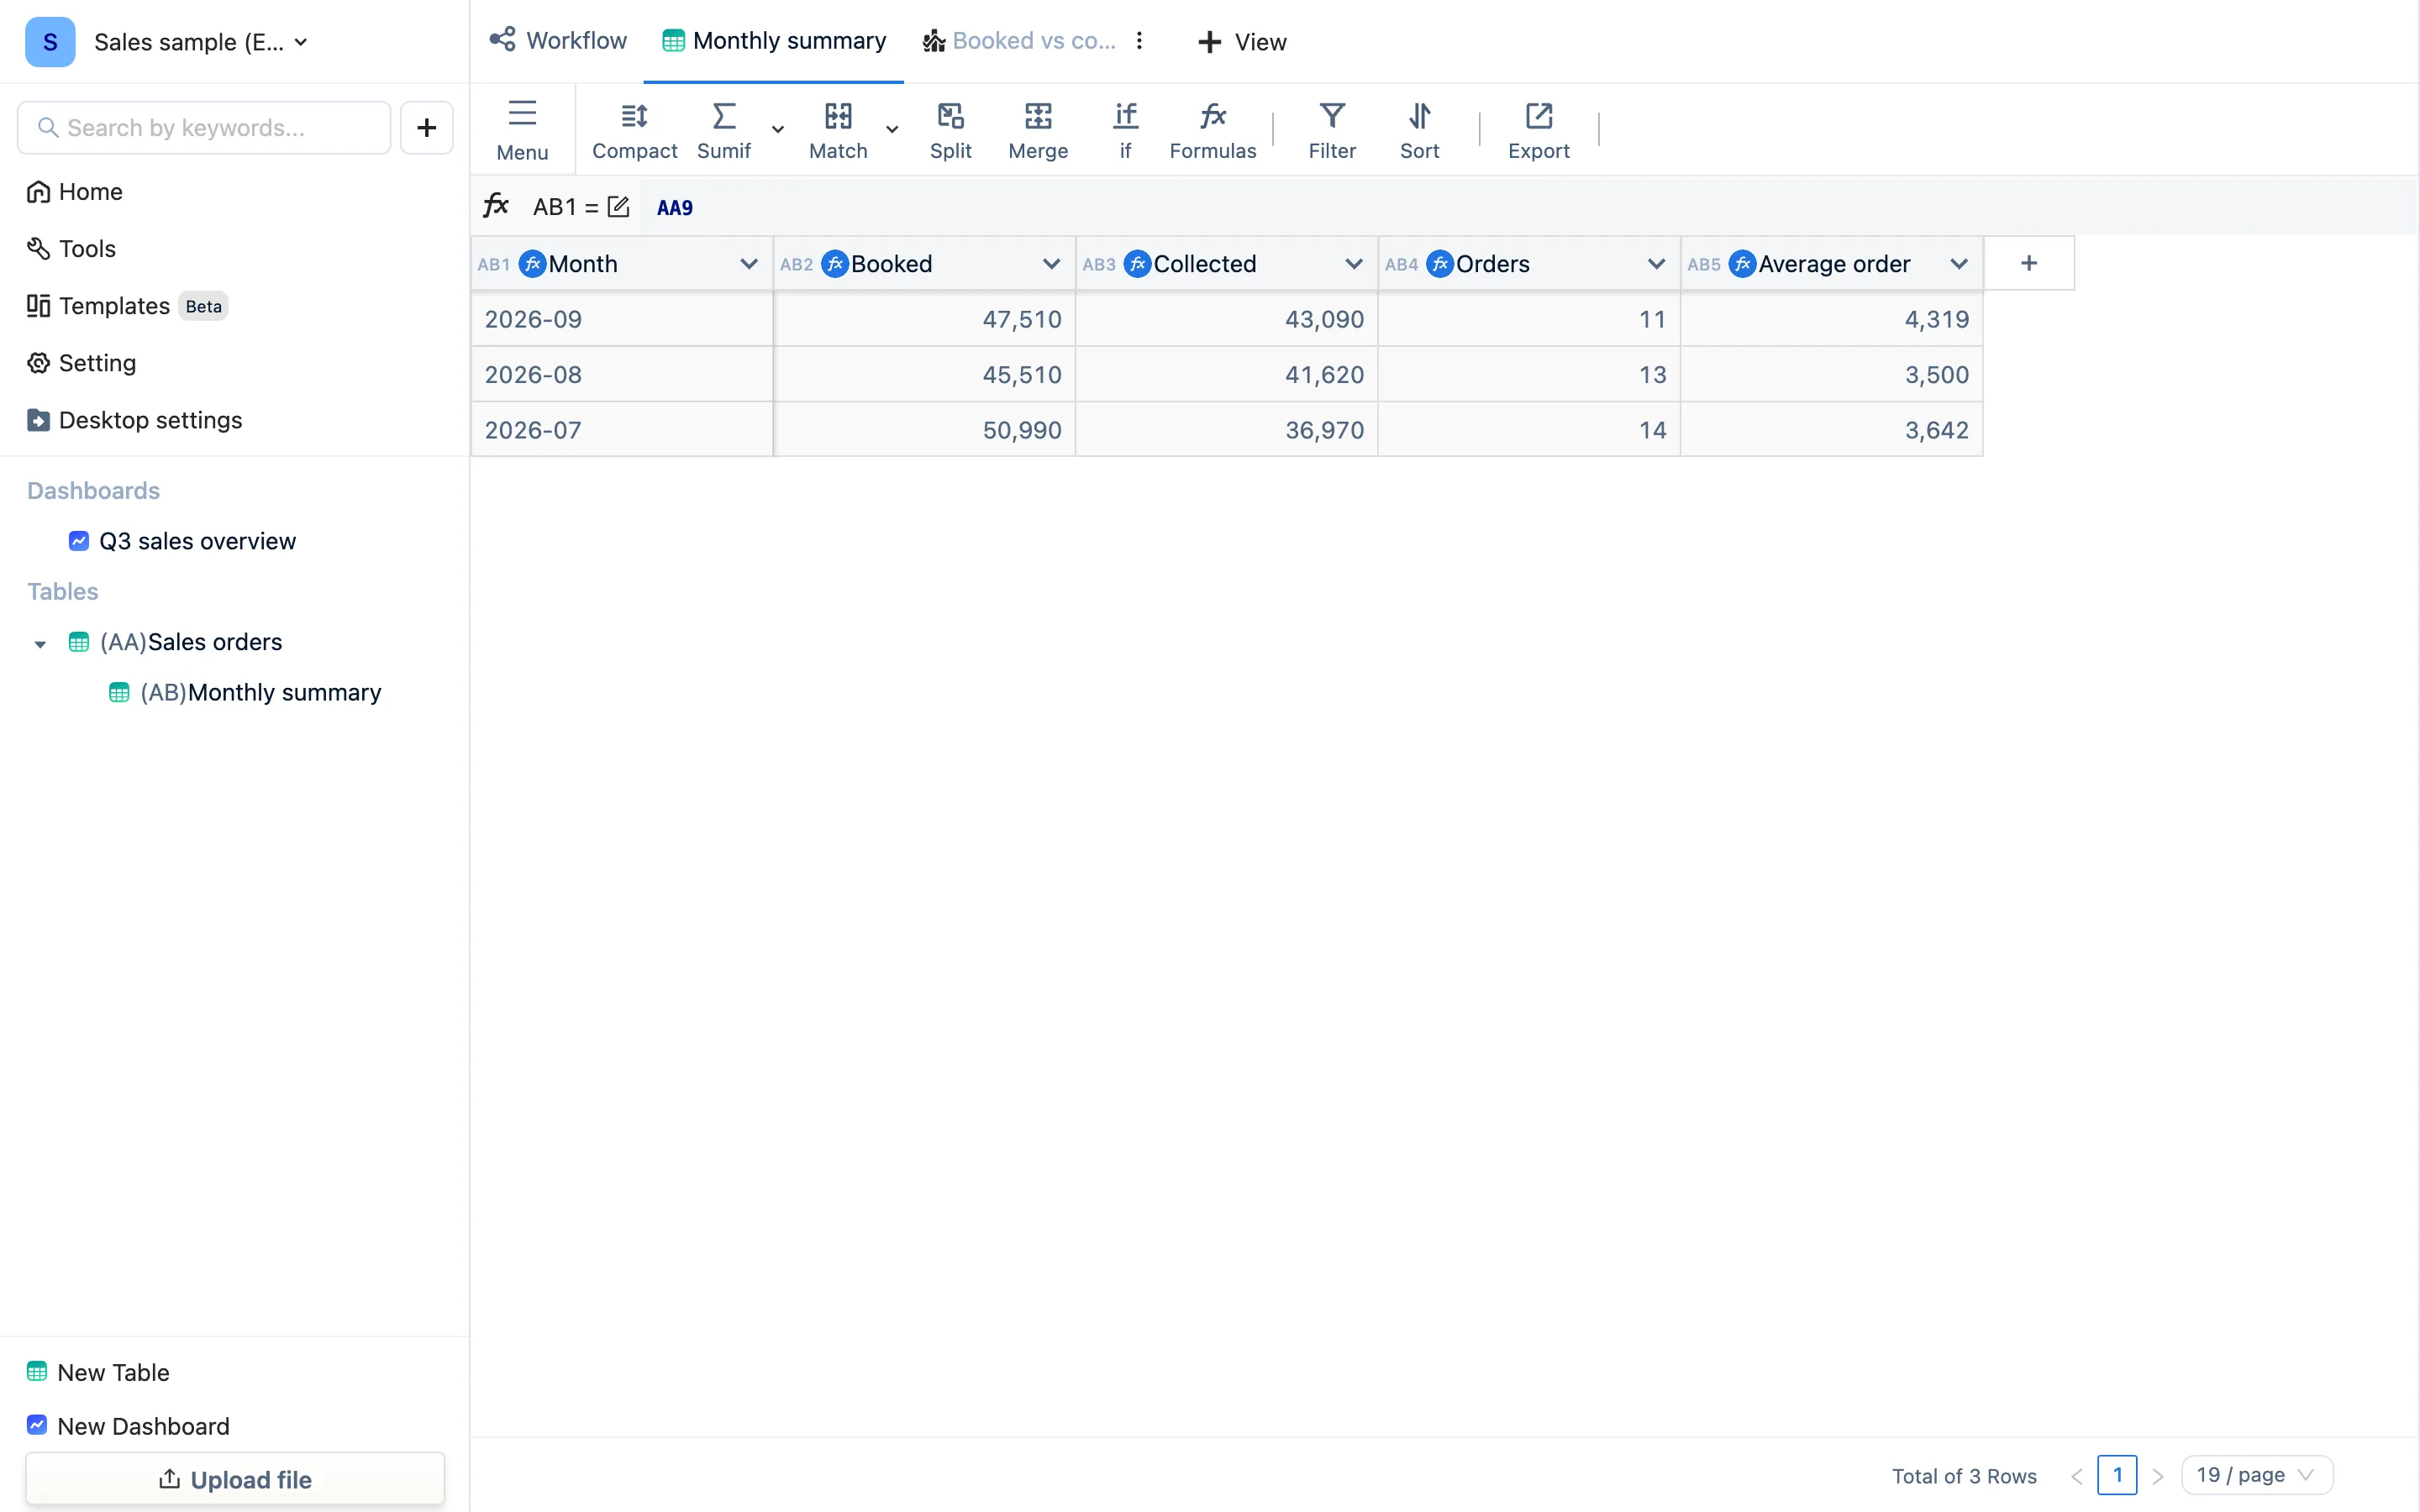
In Excel this is a pivot table, but a pivot table is inert: adding rows to the source means refreshing, and adding an average-order column beside it means pulling a separate formula. A summary table here is alive.
Two places that show who depends on whom
- The indent in the sidebar: (AB)Monthly summary sits indented under (AA)Sales orders, which means AB references AA.
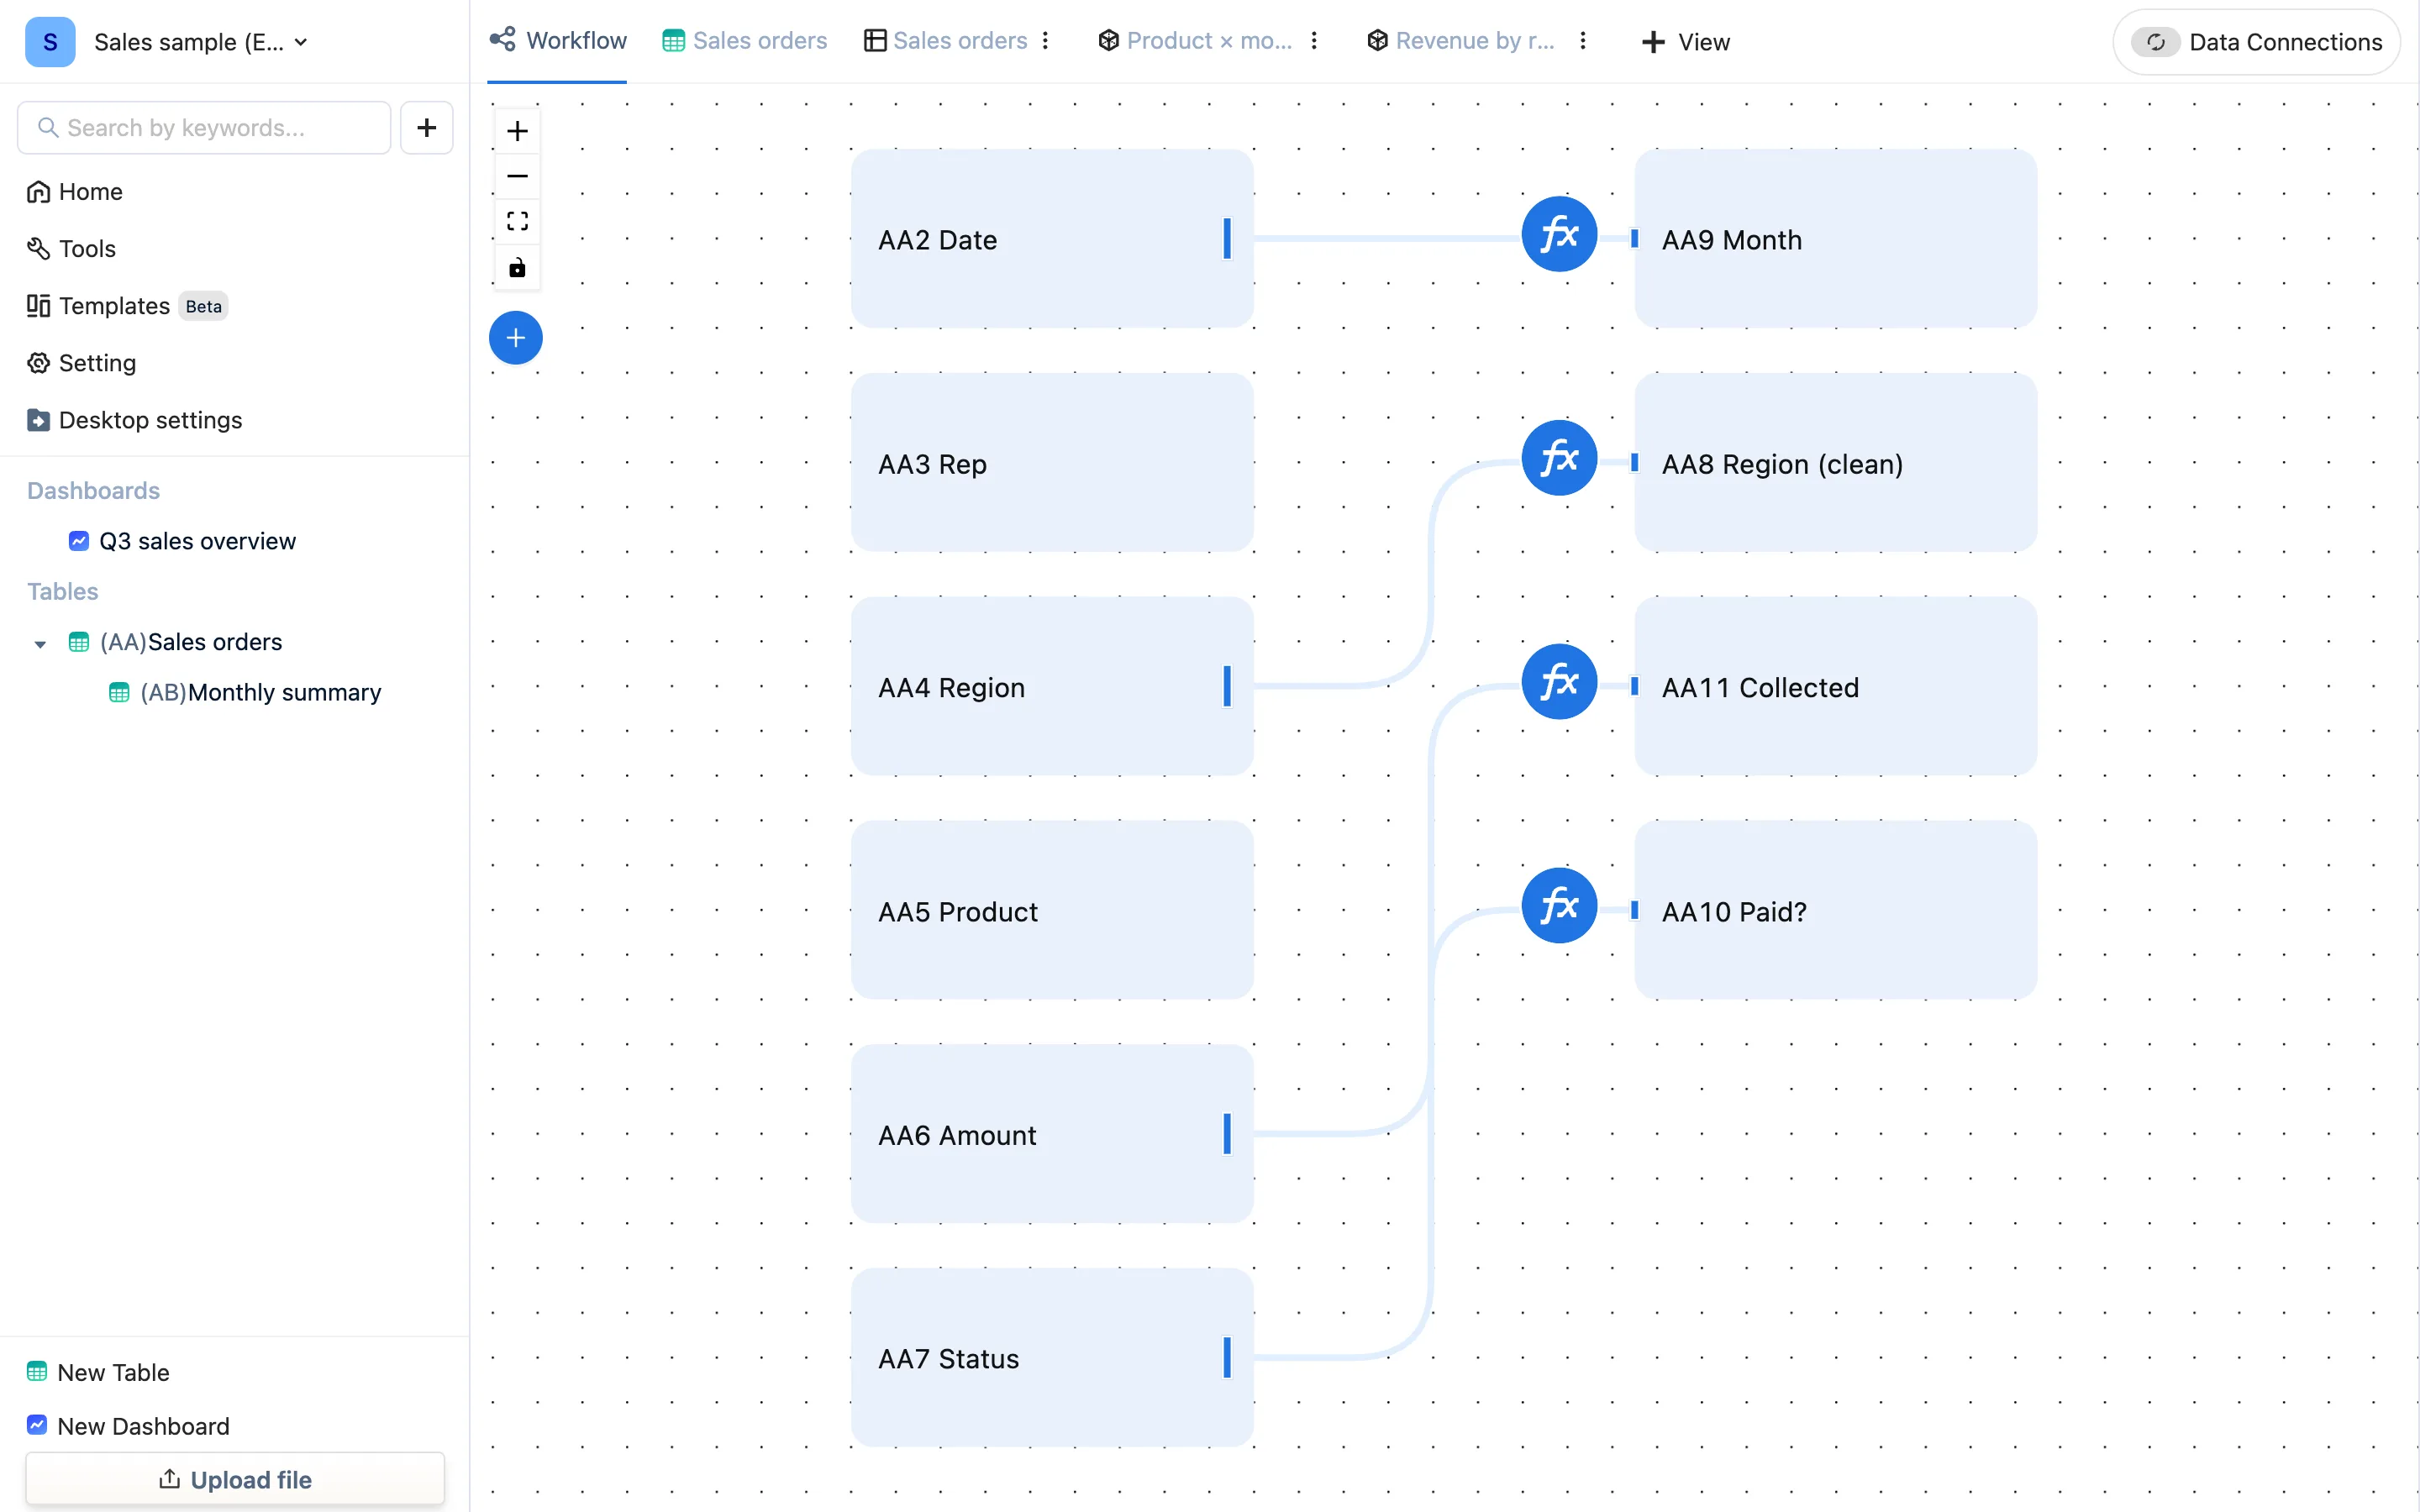
- The Workflow tab in the table editor: a graph with raw columns on the left, formula columns on the right, and arrows for references. Cross-table references are drawn in it too.
What breaks a link
A reference is by code, so renaming a column or moving it is safe. Two things do break one:
- Deleting the referenced column. The formula loses its input and the dependent column stops resolving. Delete a column only after checking the Workflow graph.
- Deleting the referenced table. Same, one level up. The sidebar indent is the warning: a table with something indented under it has dependants.
The fix in both cases is to point the formula at the right column again, or rebuild the column.
Where the update chain ends
Change one amount in the detail table and: the summary table's aggregates recalculate, every view of both tables redraws, and every dashboard component referencing those views redraws. You do nothing. That chain is what the whole product is for — and it exists because a formula belongs to a column and a view never copies data.