A tour of the interface
The sidebar, Home, Tools, Templates, Setting and Desktop settings, plus every part of the table editor and the dashboard editor. After this page you can find any button the rest of the manual mentions.
The overall layout
The window is two columns: on the left the sidebar (navigation plus your tables and dashboards), on the right the work area (Home, Tools, Templates, Setting, or one table's / one dashboard's editor).
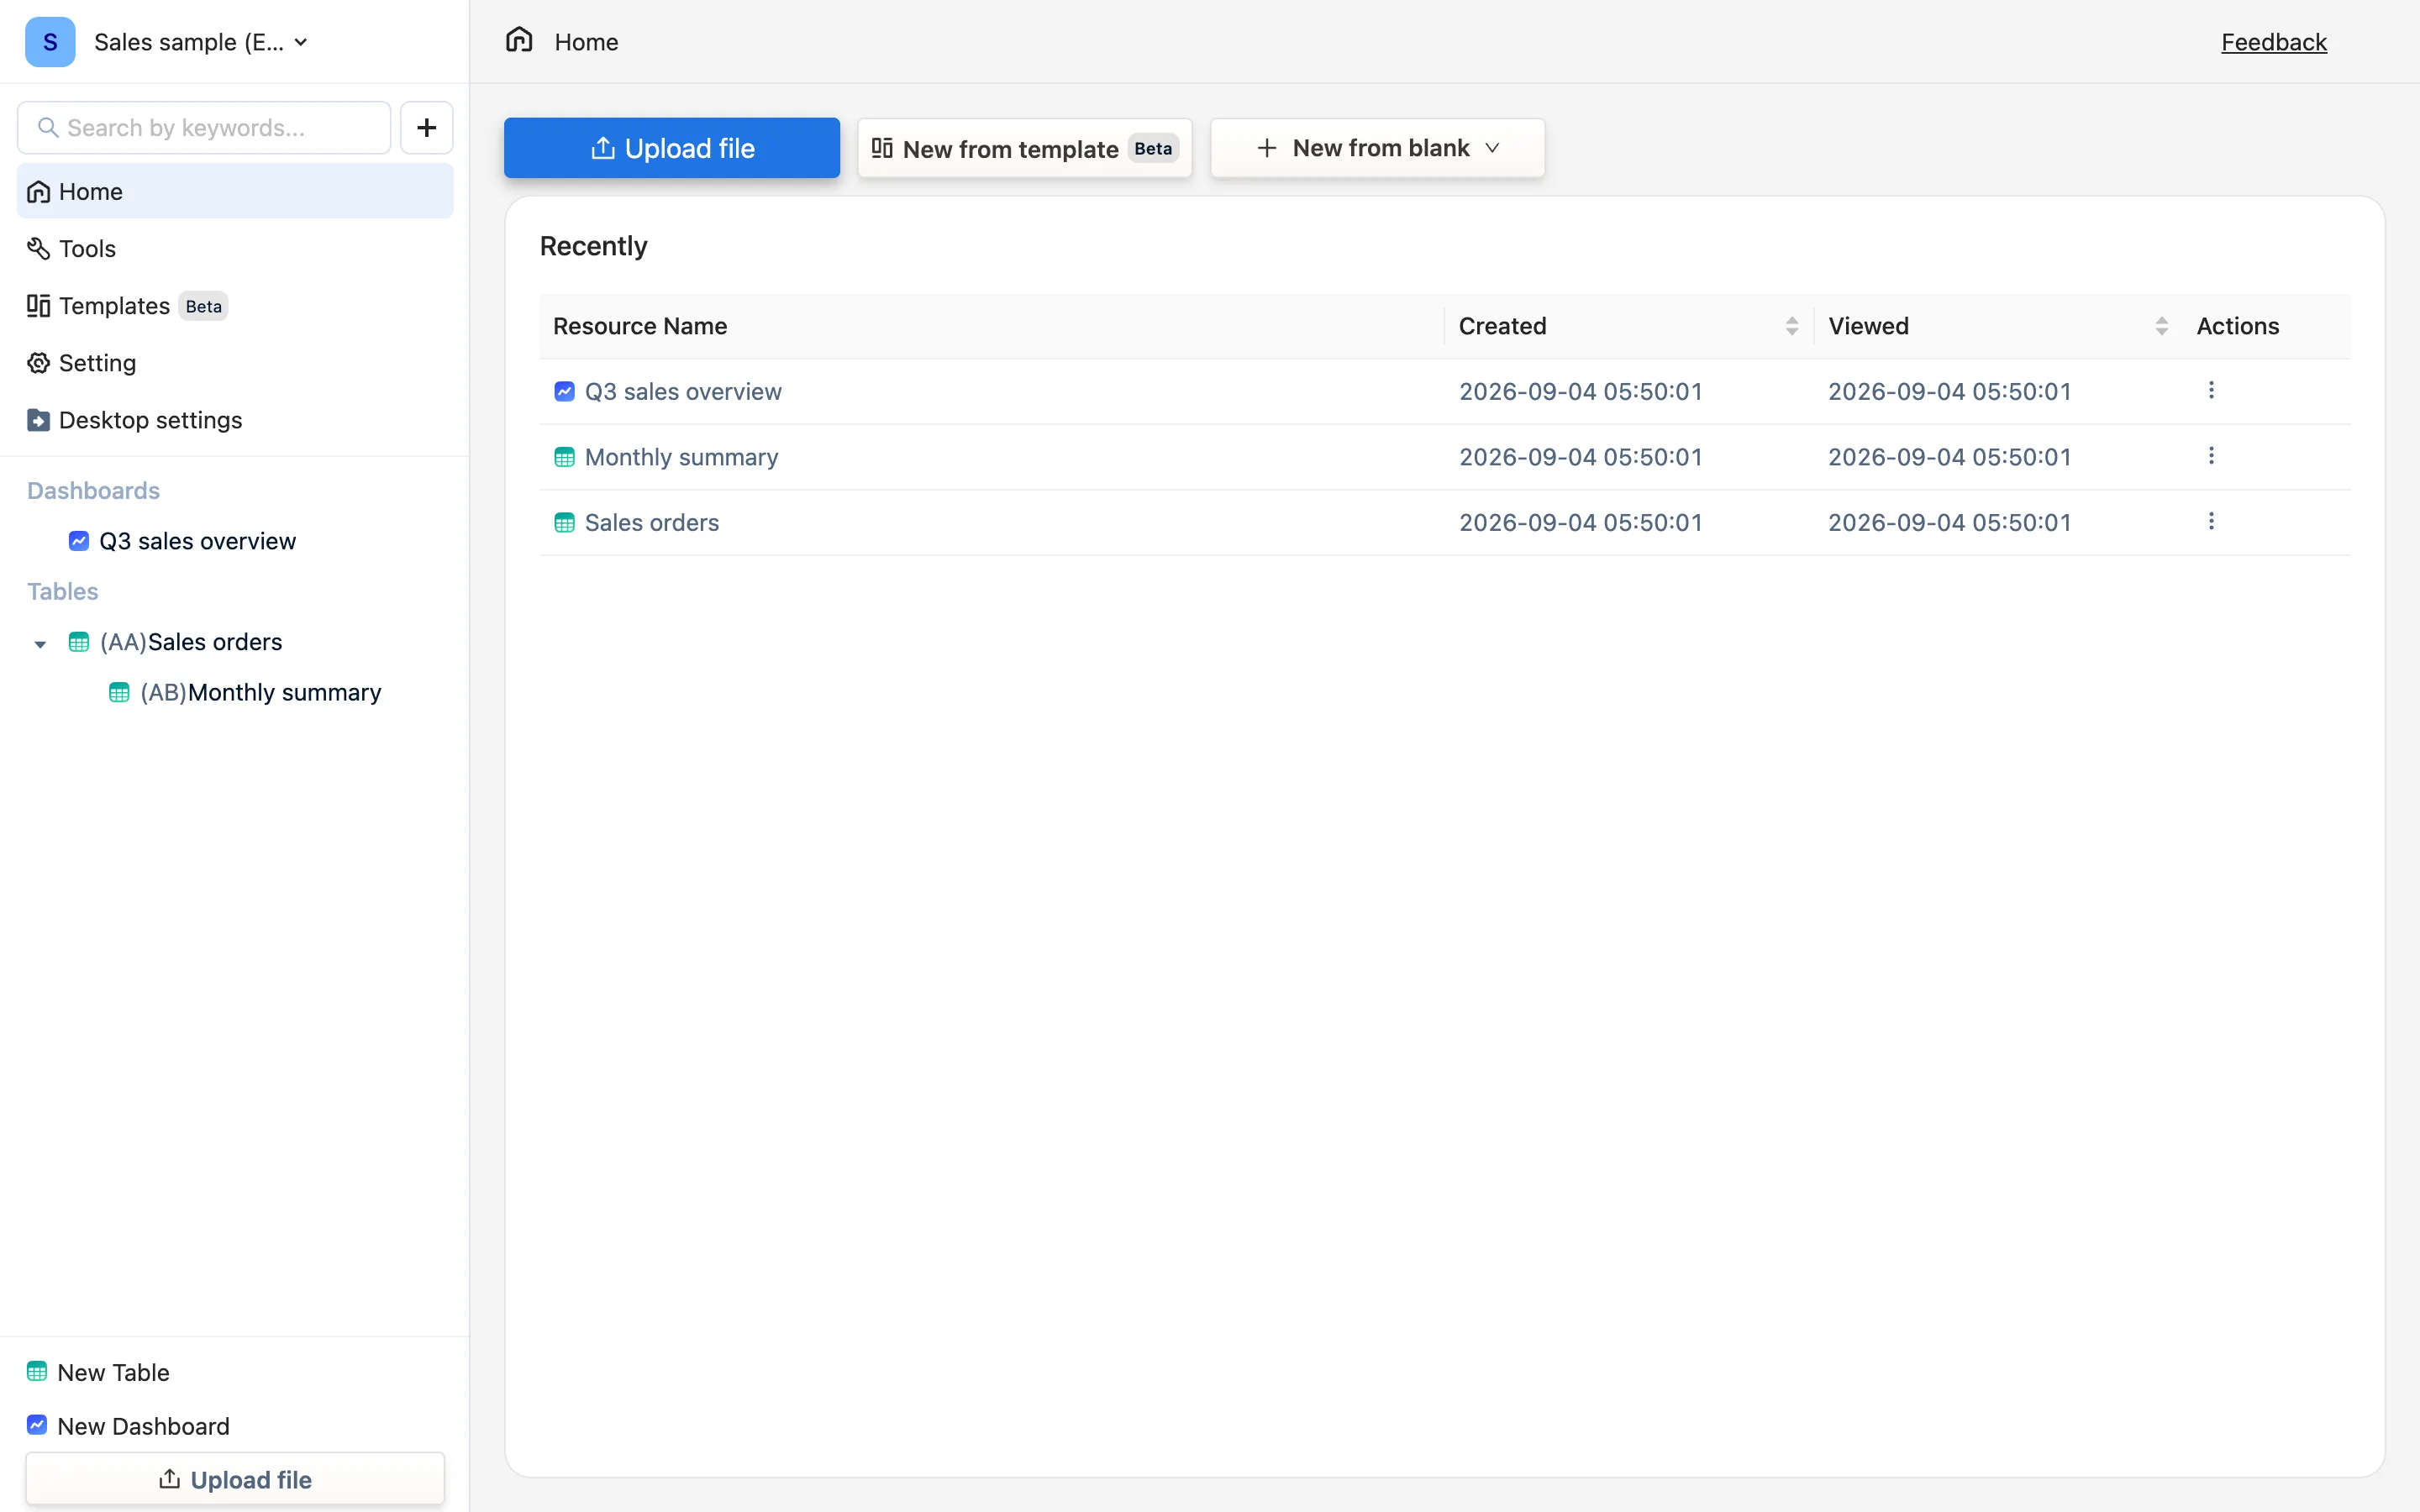
The sidebar
Top to bottom:
| Area | What it is |
|---|---|
| Workspace name (top, with a chevron) | Switch or add workspaces, and switch the interface language. A workspace is the outermost container for data; tables and dashboards all live inside one. Most single users only ever need one |
| Search box | Find a table or dashboard by name |
| Home / Tools / Templates / Setting | Four fixed pages, below |
| Desktop settings | Desktop-only: licensing, AI key, backups, privacy, About. Shortcut Cmd+, (macOS) / Ctrl+, (Windows) |
| Dashboards | Every dashboard in this workspace |
| Tables | Every table, as a tree: an indented table is calculated from the one above it |
| New Table / New Dashboard / Upload file | The three most common create actions |
Setting in the sidebar is workspace settings (rename the space, manage members) — not app settings. Backups, licensing and the AI key are all under Desktop settings, just below it. The two names are close, and this is the single most common wrong turn.
Home
Three buttons across the top: Upload file (build a table from Excel / CSV), New from template (a bundled sample or a local template file — it carries a Beta tag), and New from blank (an empty table or dashboard). Below them, Recently is a four-column table — resource name, created, last opened, actions. Hover a row and a ⋮ appears in the Actions column; it opens Rename and Delete. With nothing in the workspace yet it reads "No tables or dashboards available yet."
Tools
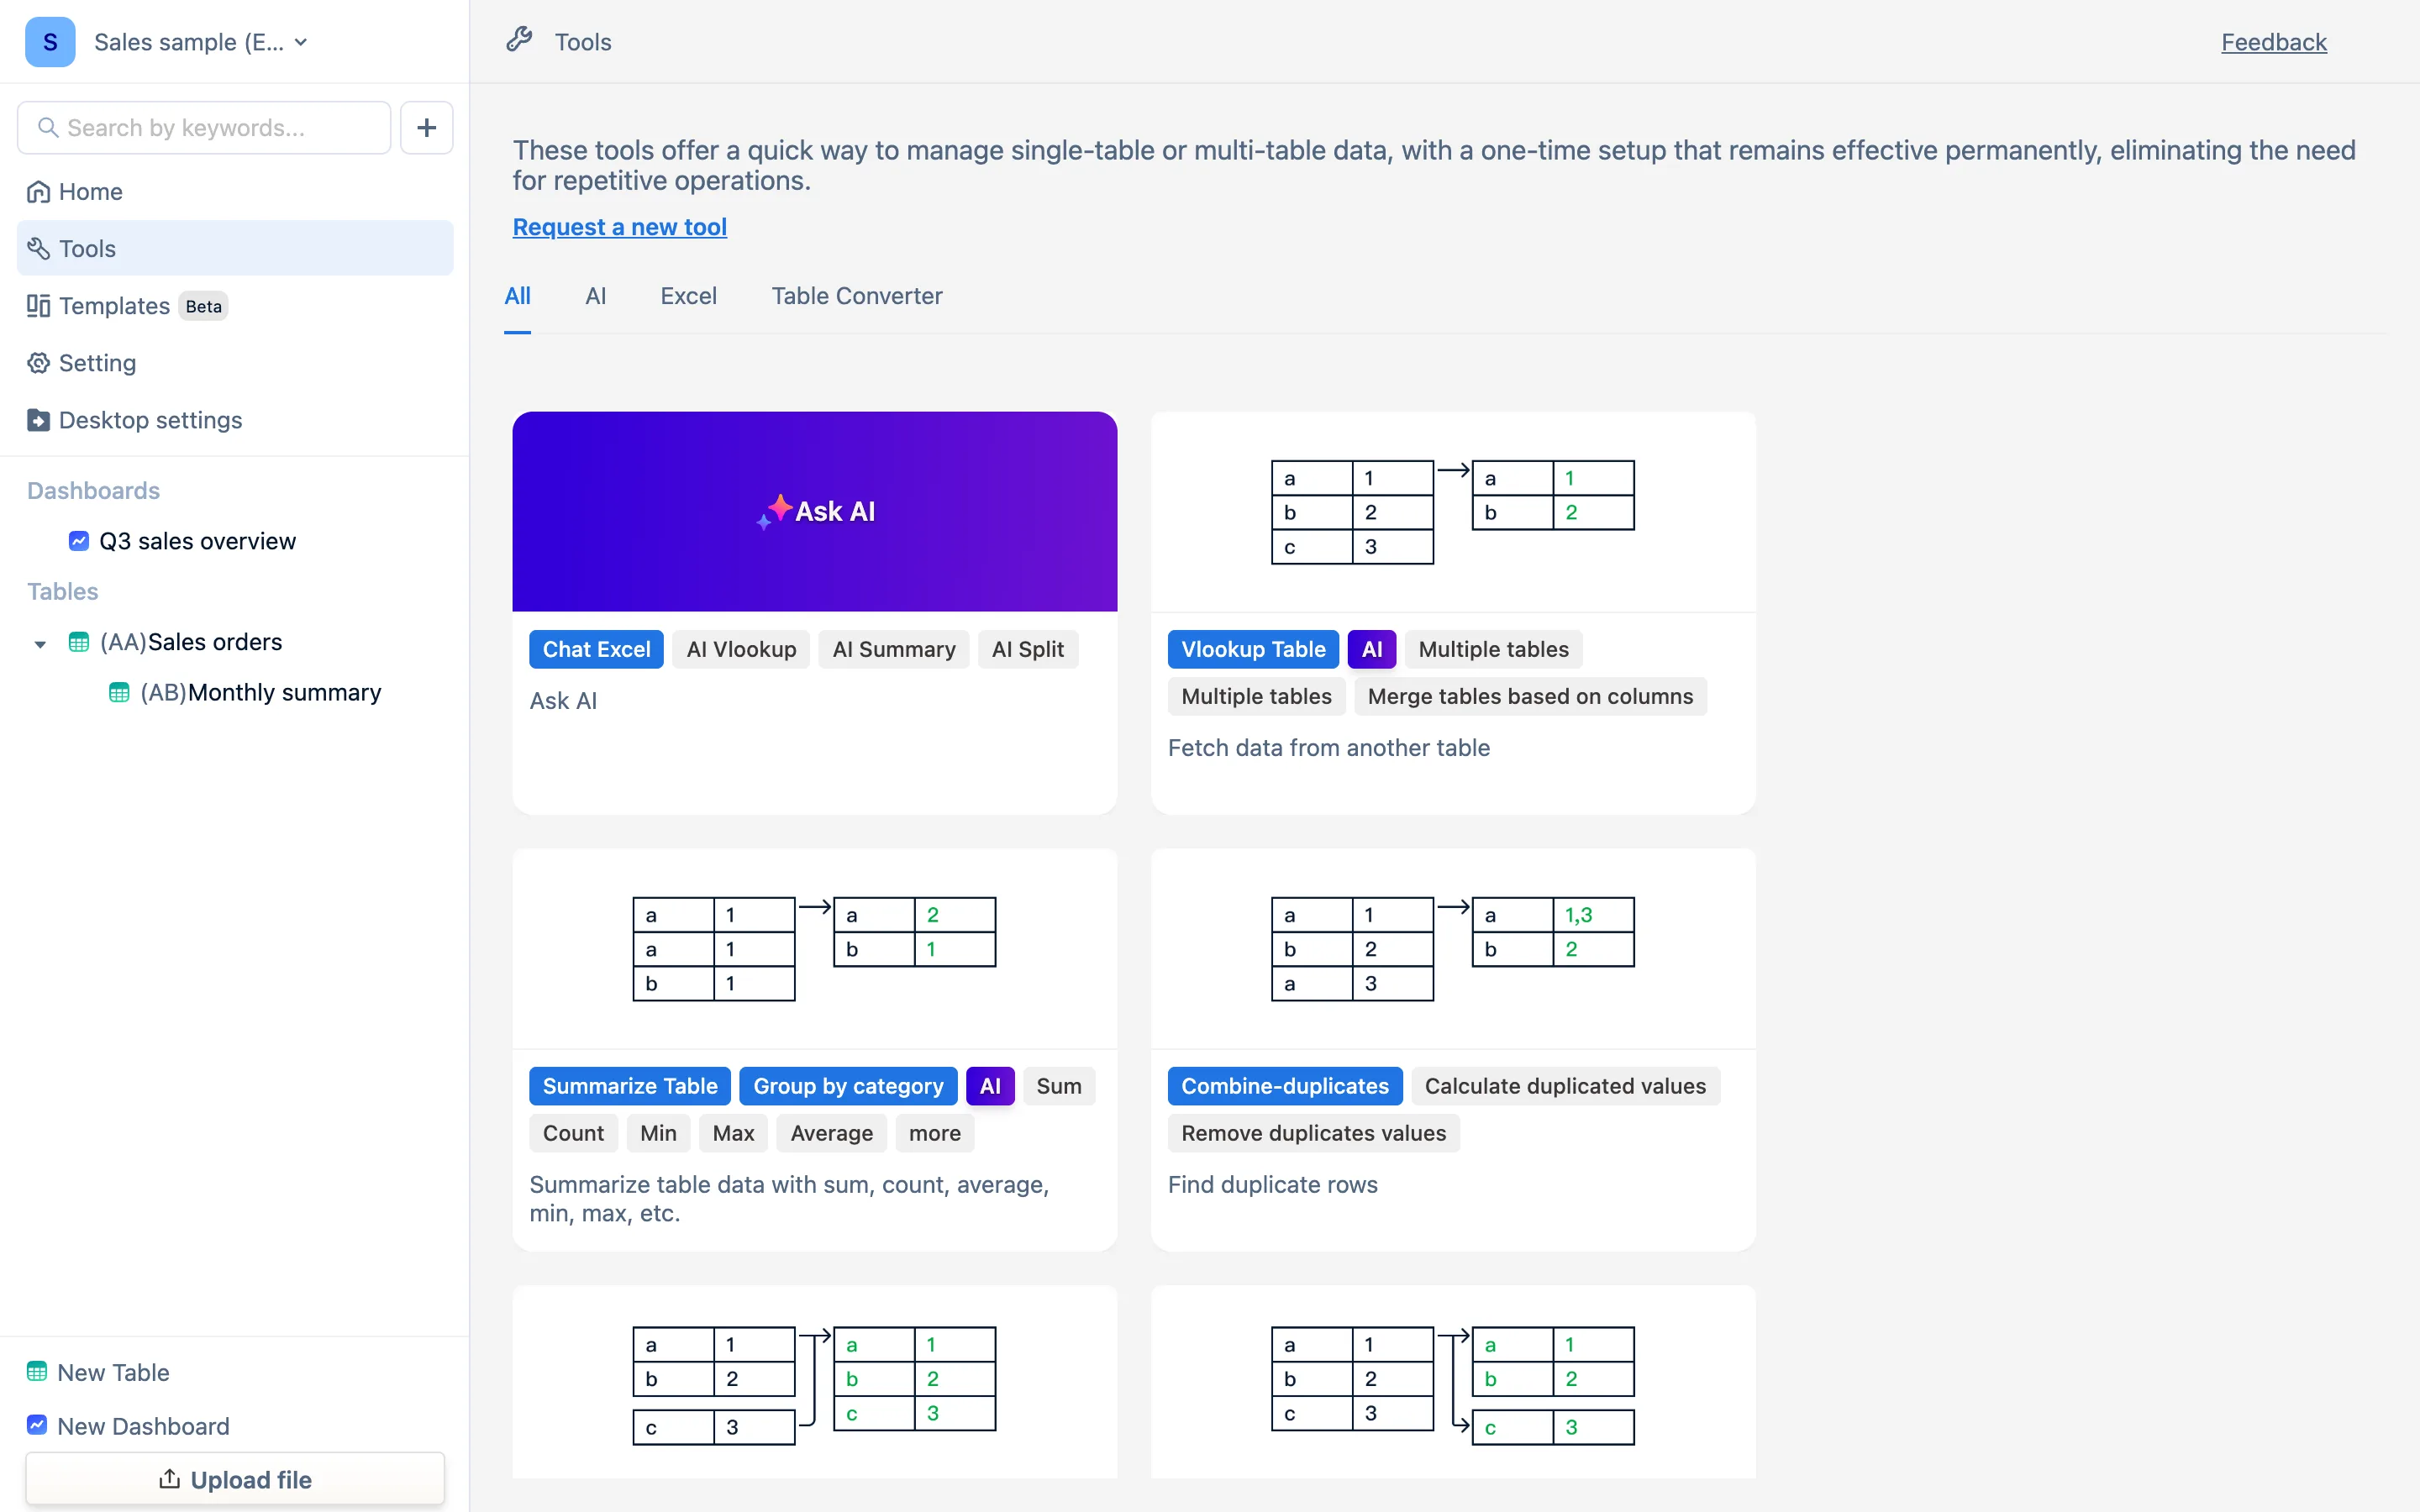
Each card is a standalone wizard — you do not have to open a table first. The tabs across the top group them, and the cards cover: asking AI to process a spreadsheet (paid), Vlookup-style matching across tables, Summarize (group totals, counts, averages), merging and de-duplicating repeated rows, stacking tables by row, splitting one table into many, pulling year/month/week out of dates, image- and JSON-to-table, and cross-table Sumif / Countif.
Whatever a tool produces is an ordinary table or formula column afterwards, editable like anything else.
Templates
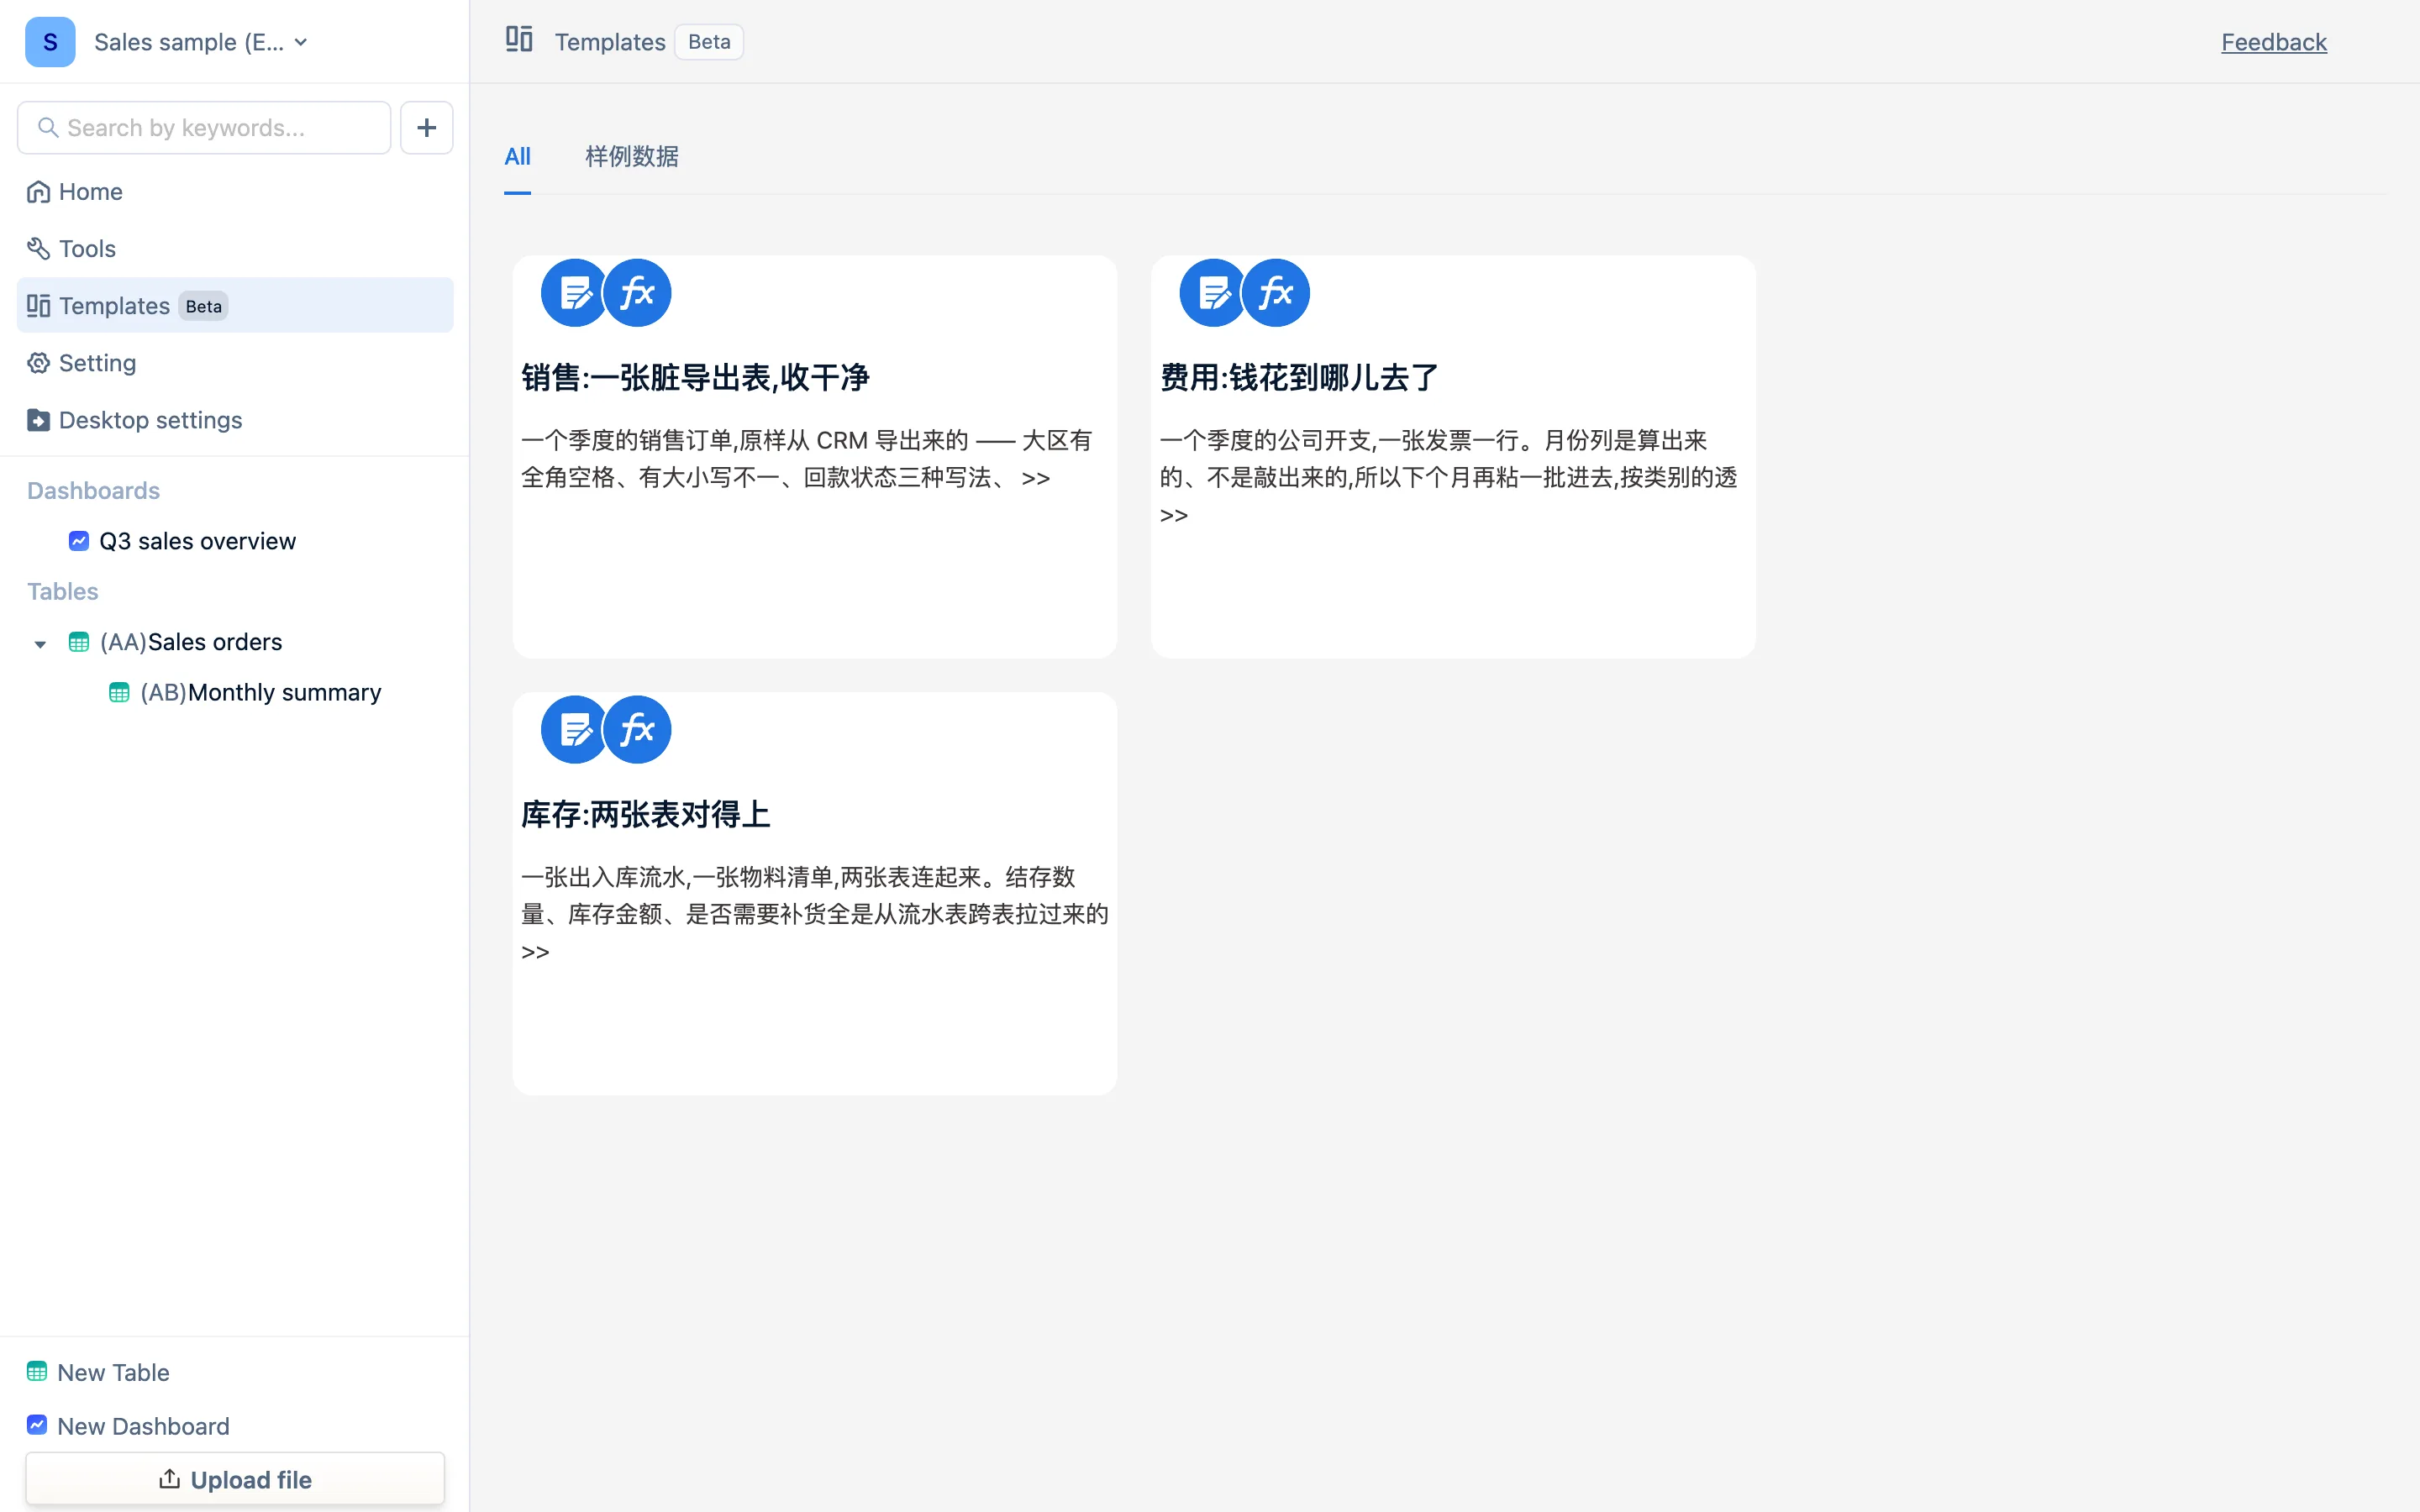
Three bundled samples (sales, expenses, stock), each a set of tables plus formulas plus a dashboard. You can also load a local .json template file. Templates are added on top of the current workspace — they never touch tables you already have.
Setting
Workspace settings: the workspace name; the Members tab manages members and roles in the team edition and is unused in the personal edition.
The table editor
Click any table in the sidebar. Four bands, top to bottom:
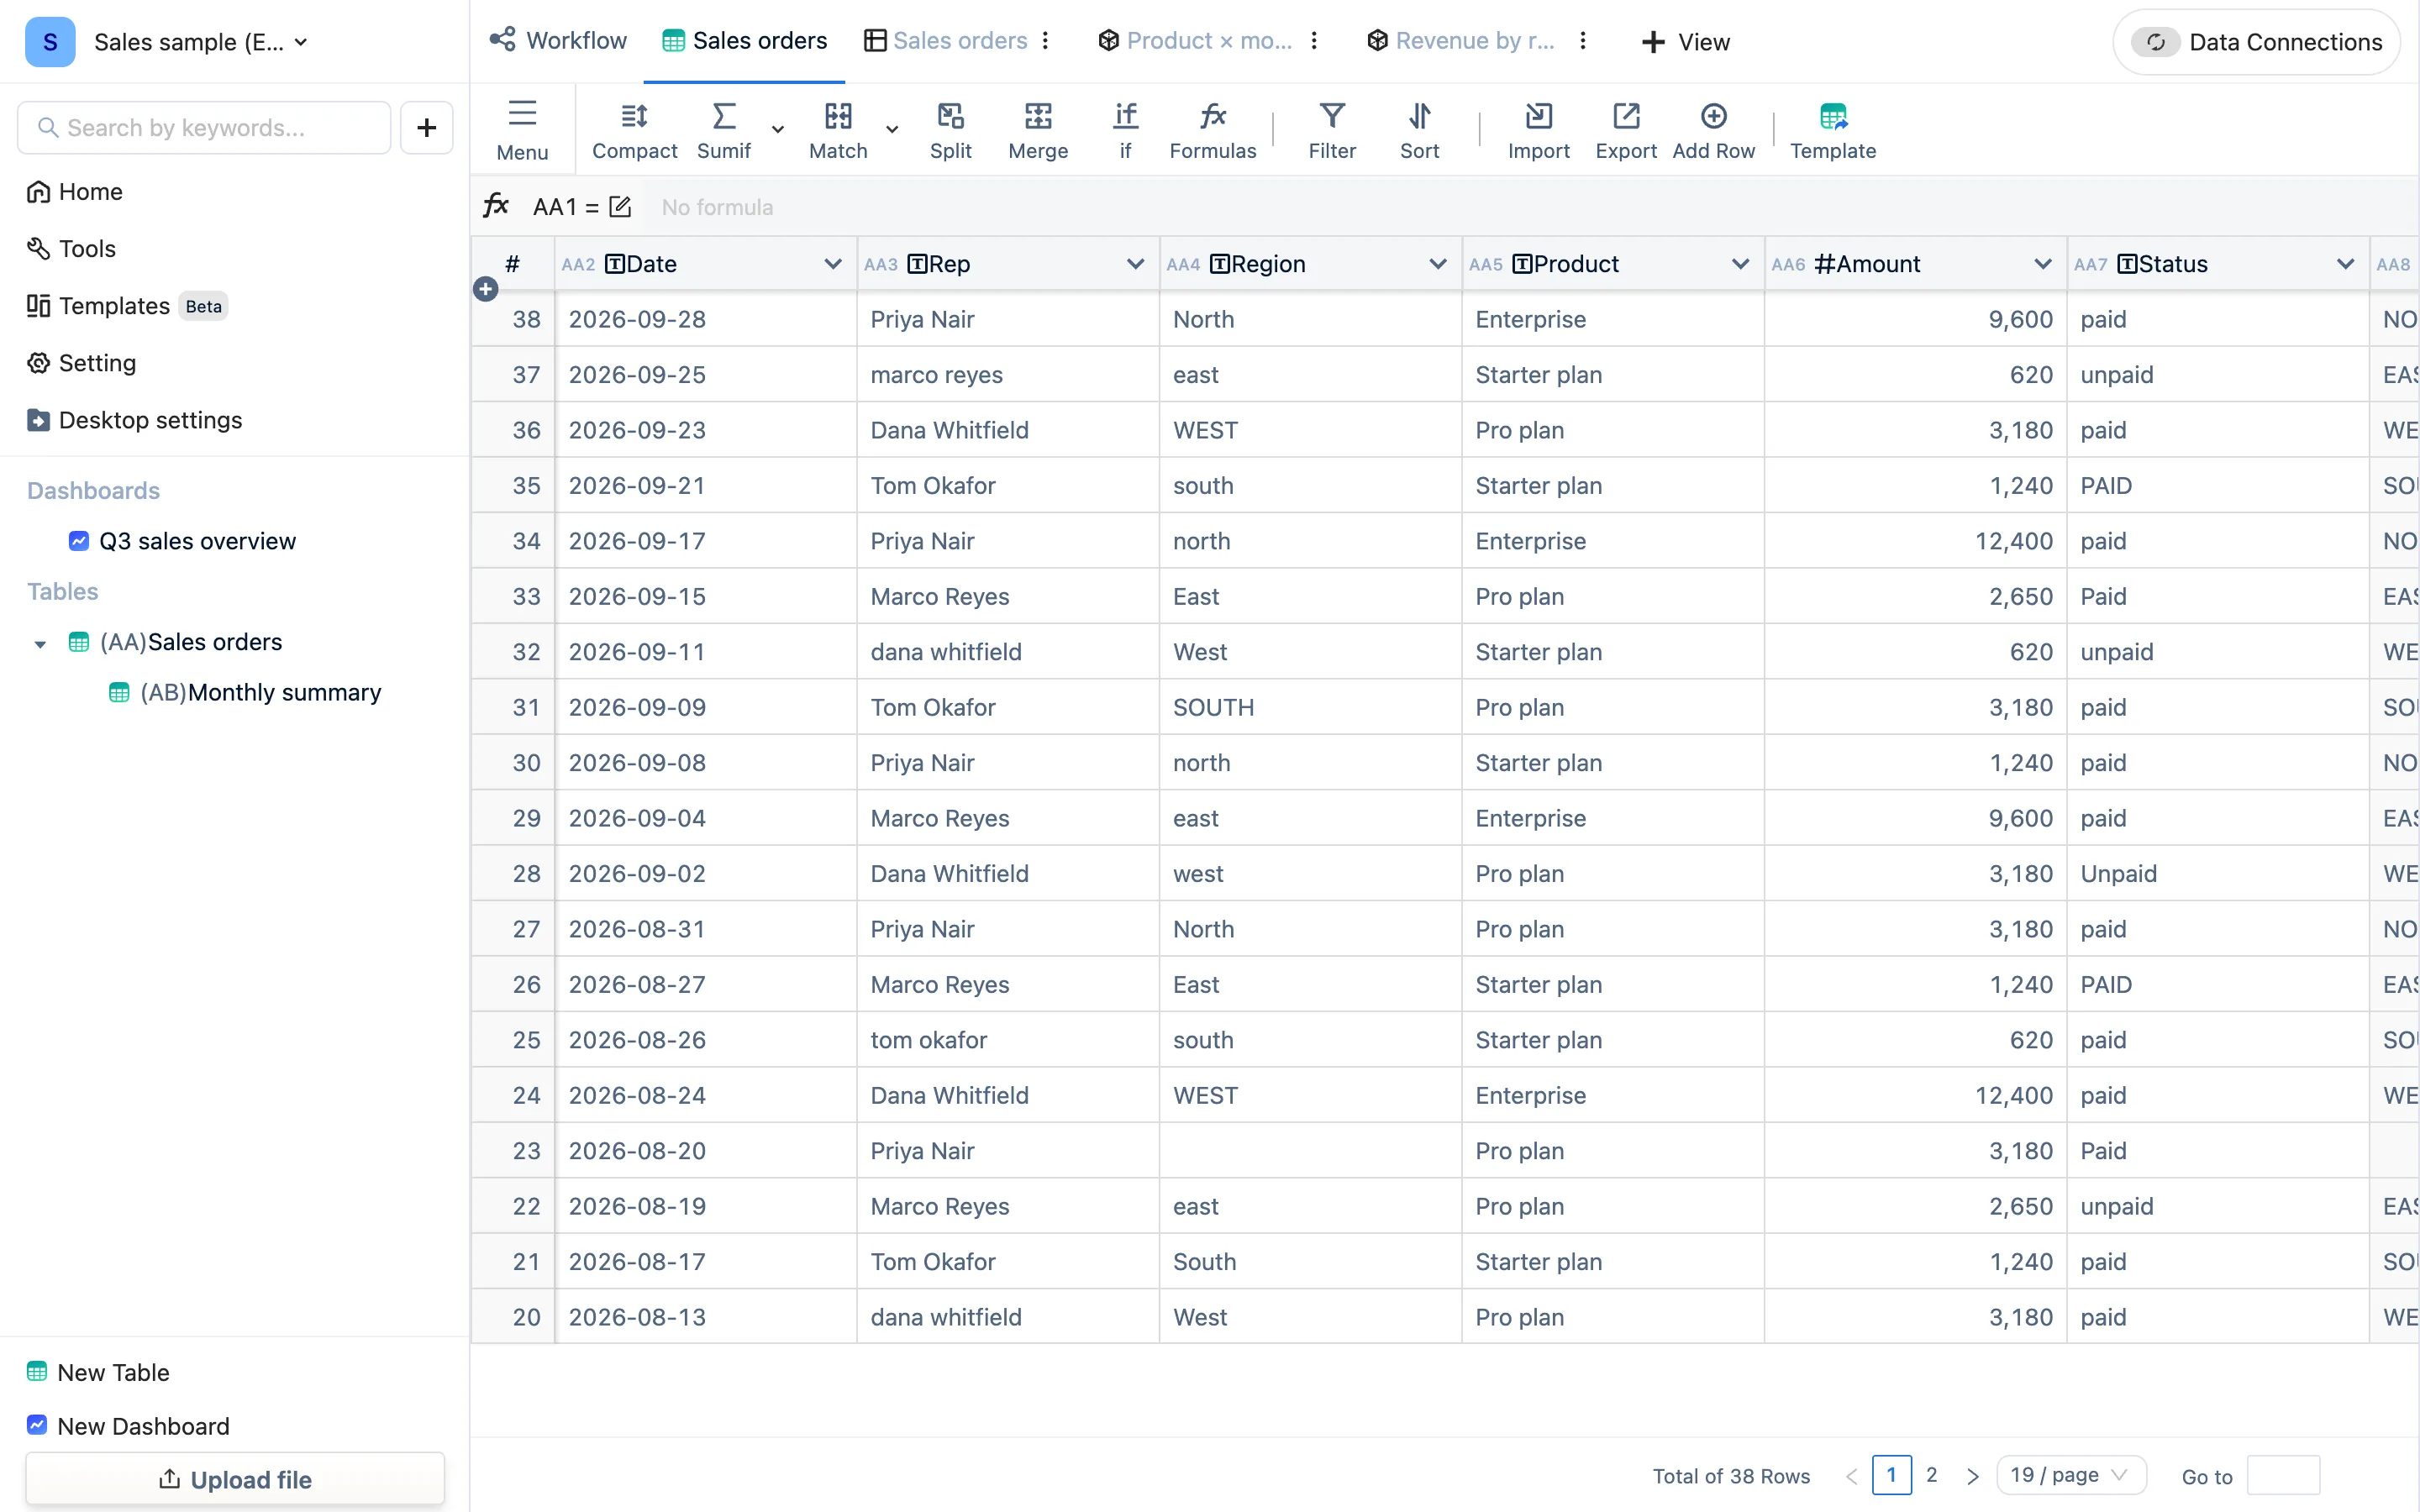
1. Tab bar (top row) Workflow → this table's views (the first one is always the table itself) → + View (add a view). At the far right sits Data Connections (connect an external source).
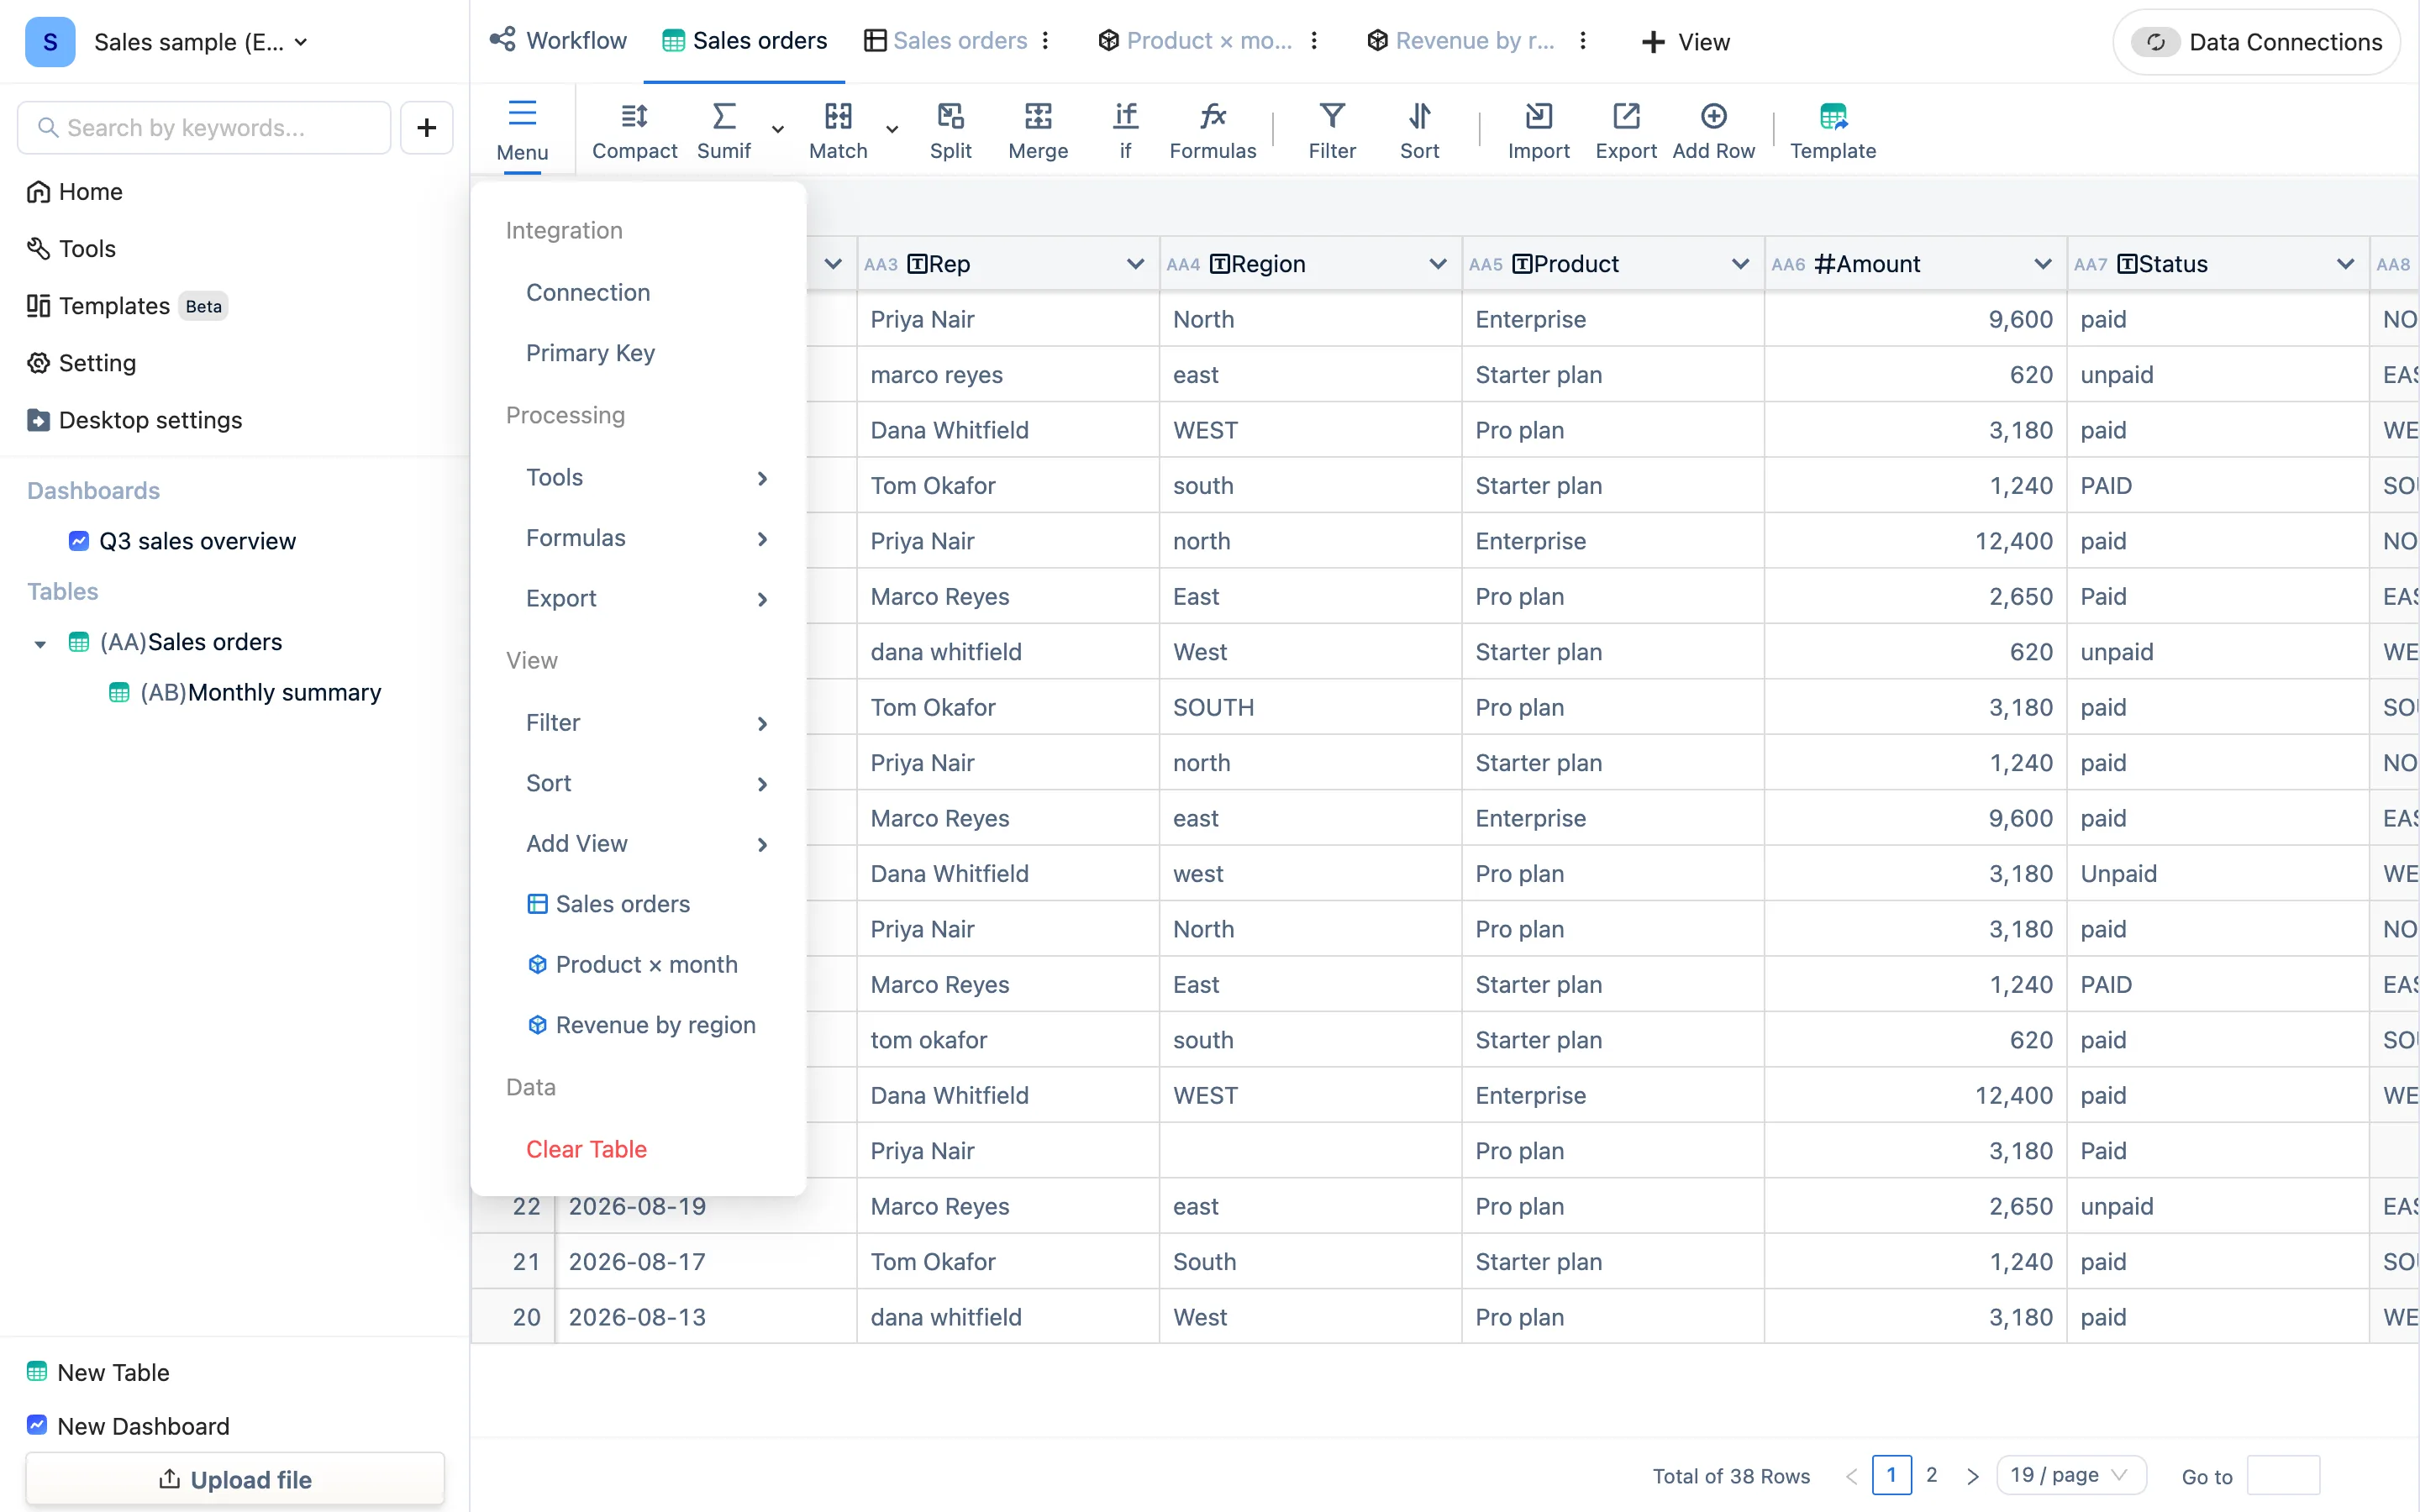
2. Toolbar
| Button | What it does |
|---|---|
| Menu | Everything this table can do, grouped |
| Compact | Row-height toggle |
| Sumif / Match / Split / Merge / if | The five formula panels — numbered steps, live preview, and out comes a formula column or a new table. This is the main way in if you would rather not write formulas |
| Formulas | Browse every function by category: text, time, relation, calculation |
| Filter / Sort | Affects only the current view's display, never the data |
| Import | Upload file / from an image / from JSON (appended to this table) |
| Export | Excel, CSV, the data API, or a template |
| Add Row | An empty row, or a form to submit one |
| Template | Downloads an Excel with the headers and nothing else — fill it in against those column names and the import cannot mis-map |
3. Formula bar
Shows the selected column's code and formula, like AA8 = UPPER(TRIM(AA4)). Click a header to select the column and edit the formula right there, with code highlighting and completion. A column with no formula reads No formula.
4. Headers and data
Each header has three parts: the column code (AA2), a type icon (T text, # numeric, a calendar for dates, fx for a formula column) and the column name. The chevron on the right of a header opens: process this column, edit formula, field type, filter, sort, add column, delete column. Double-click a cell to edit; the newest rows sit at the top. The footer shows the total row count and paging.
Dashboards
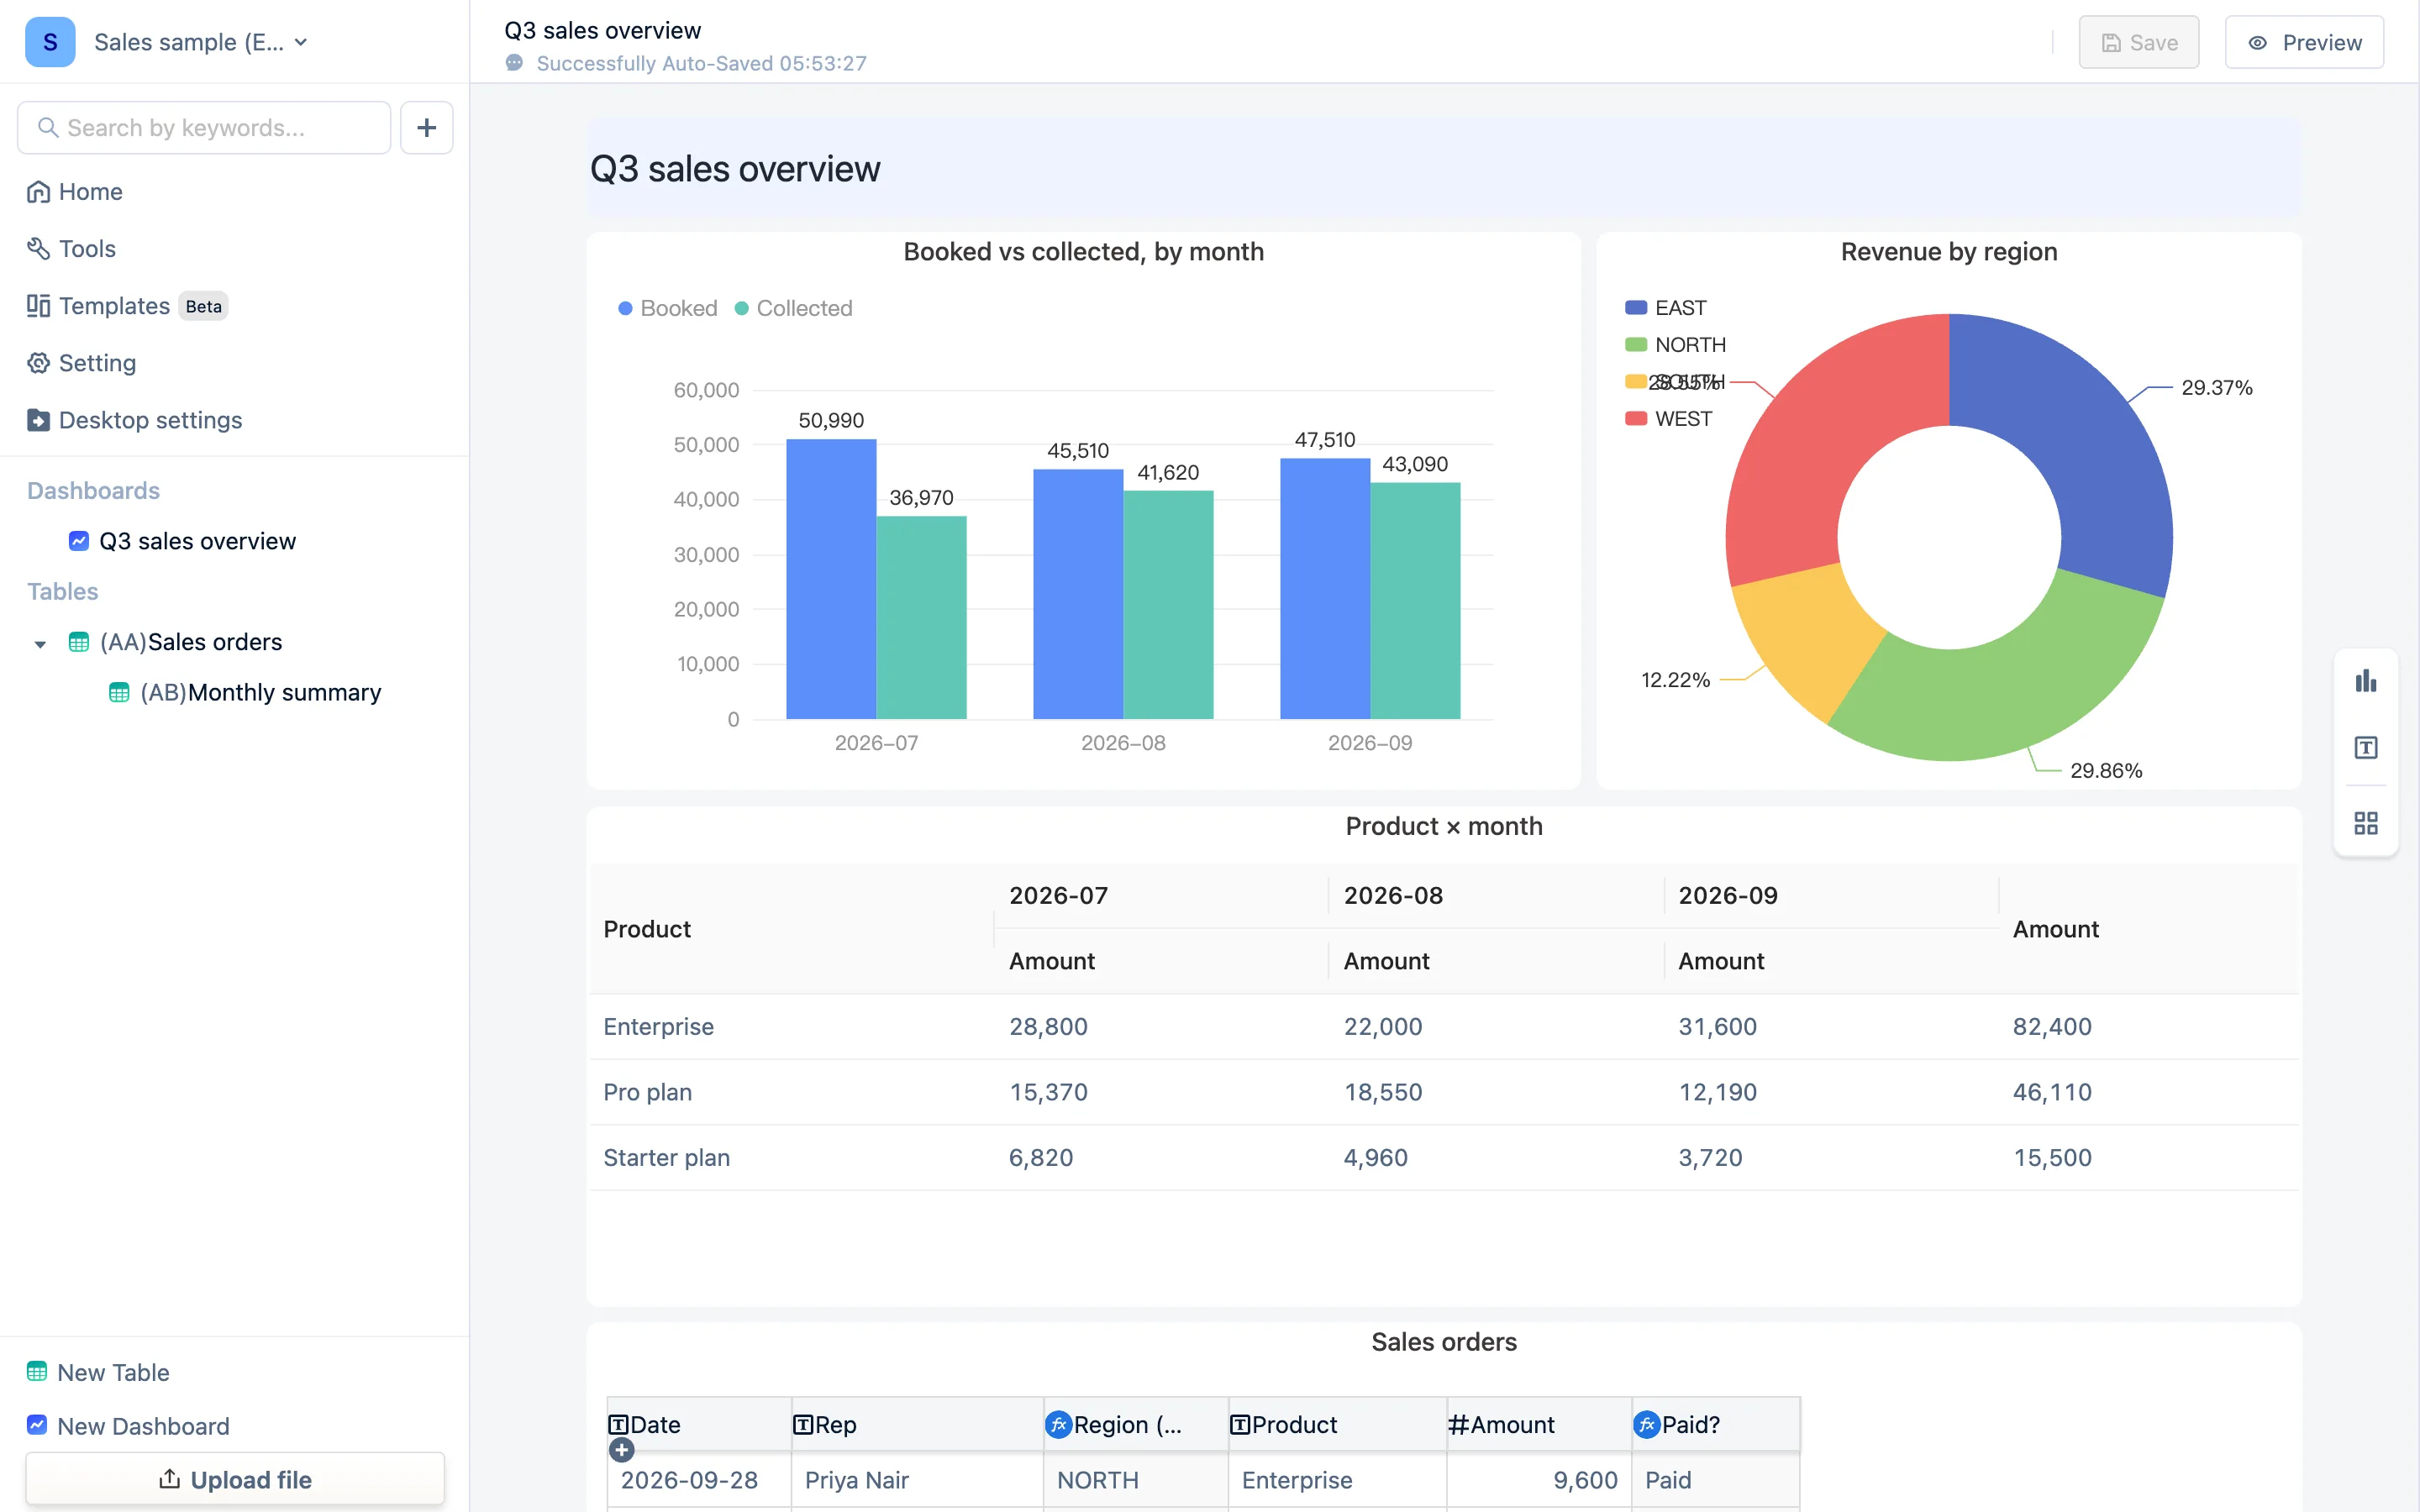
A dashboard has two modes. View mode only displays, with Share and Edit side by side at the top right. Edit mode lets you drag and resize each block, and the buttons on the right add charts, add non-data components (text, embedded page, text input, date picker) or choose the data behind a block. Changes save themselves.
Desktop settings
Press Cmd+, / Ctrl+,. Five tabs:
- License — current status, enter a key to activate, deactivate this computer
- AI — your own API key, endpoint, model
- Data backup — export and import
.tdbk - Privacy & diagnostics — the anonymous crash-report switch
- About — version number, check for updates
The full chapter is Desktop settings and licensing.
Next
Free vs paid — one page on what costs nothing, what costs money, and what happens when you hit the line.