Growing a summary table out of a detail table
TableDI's version of a pivot table, except it is a real table — you can add columns to it, reference it from elsewhere, chart it and export it. Two steps to build one, plus how to group on two dimensions.
The idea
The detail table (sales orders, say) has one row per transaction; you want one row per month. Two steps:
- The new table's first column references the detail table's grouping column — it automatically takes every distinct value of that column, one per row.
- Every column after it is a conditional aggregate whose condition is "the detail table's grouping column equals this row's first column".
Step by step
Using the sample workspace, where detail table AA Sales orders has Month AA9, Amount AA6 and Collected AA11:
- New Table in the sidebar, named "Monthly summary". Its code is
AB. - Click the header of the first column
AB1→ Define Formula, and writeAA9. Three rows appear immediately: 2026-07, 2026-08, 2026-09. - Add a column called "Booked" with the formula
sumif(AA6, AB1 = AA9). - Add "Collected"
sumif(AA11, AB1 = AA9)and "Orders"countif(AA2, AB1 = AA9). - Finally "Average order"
AB2 / AB4— two columns of this same table divided.
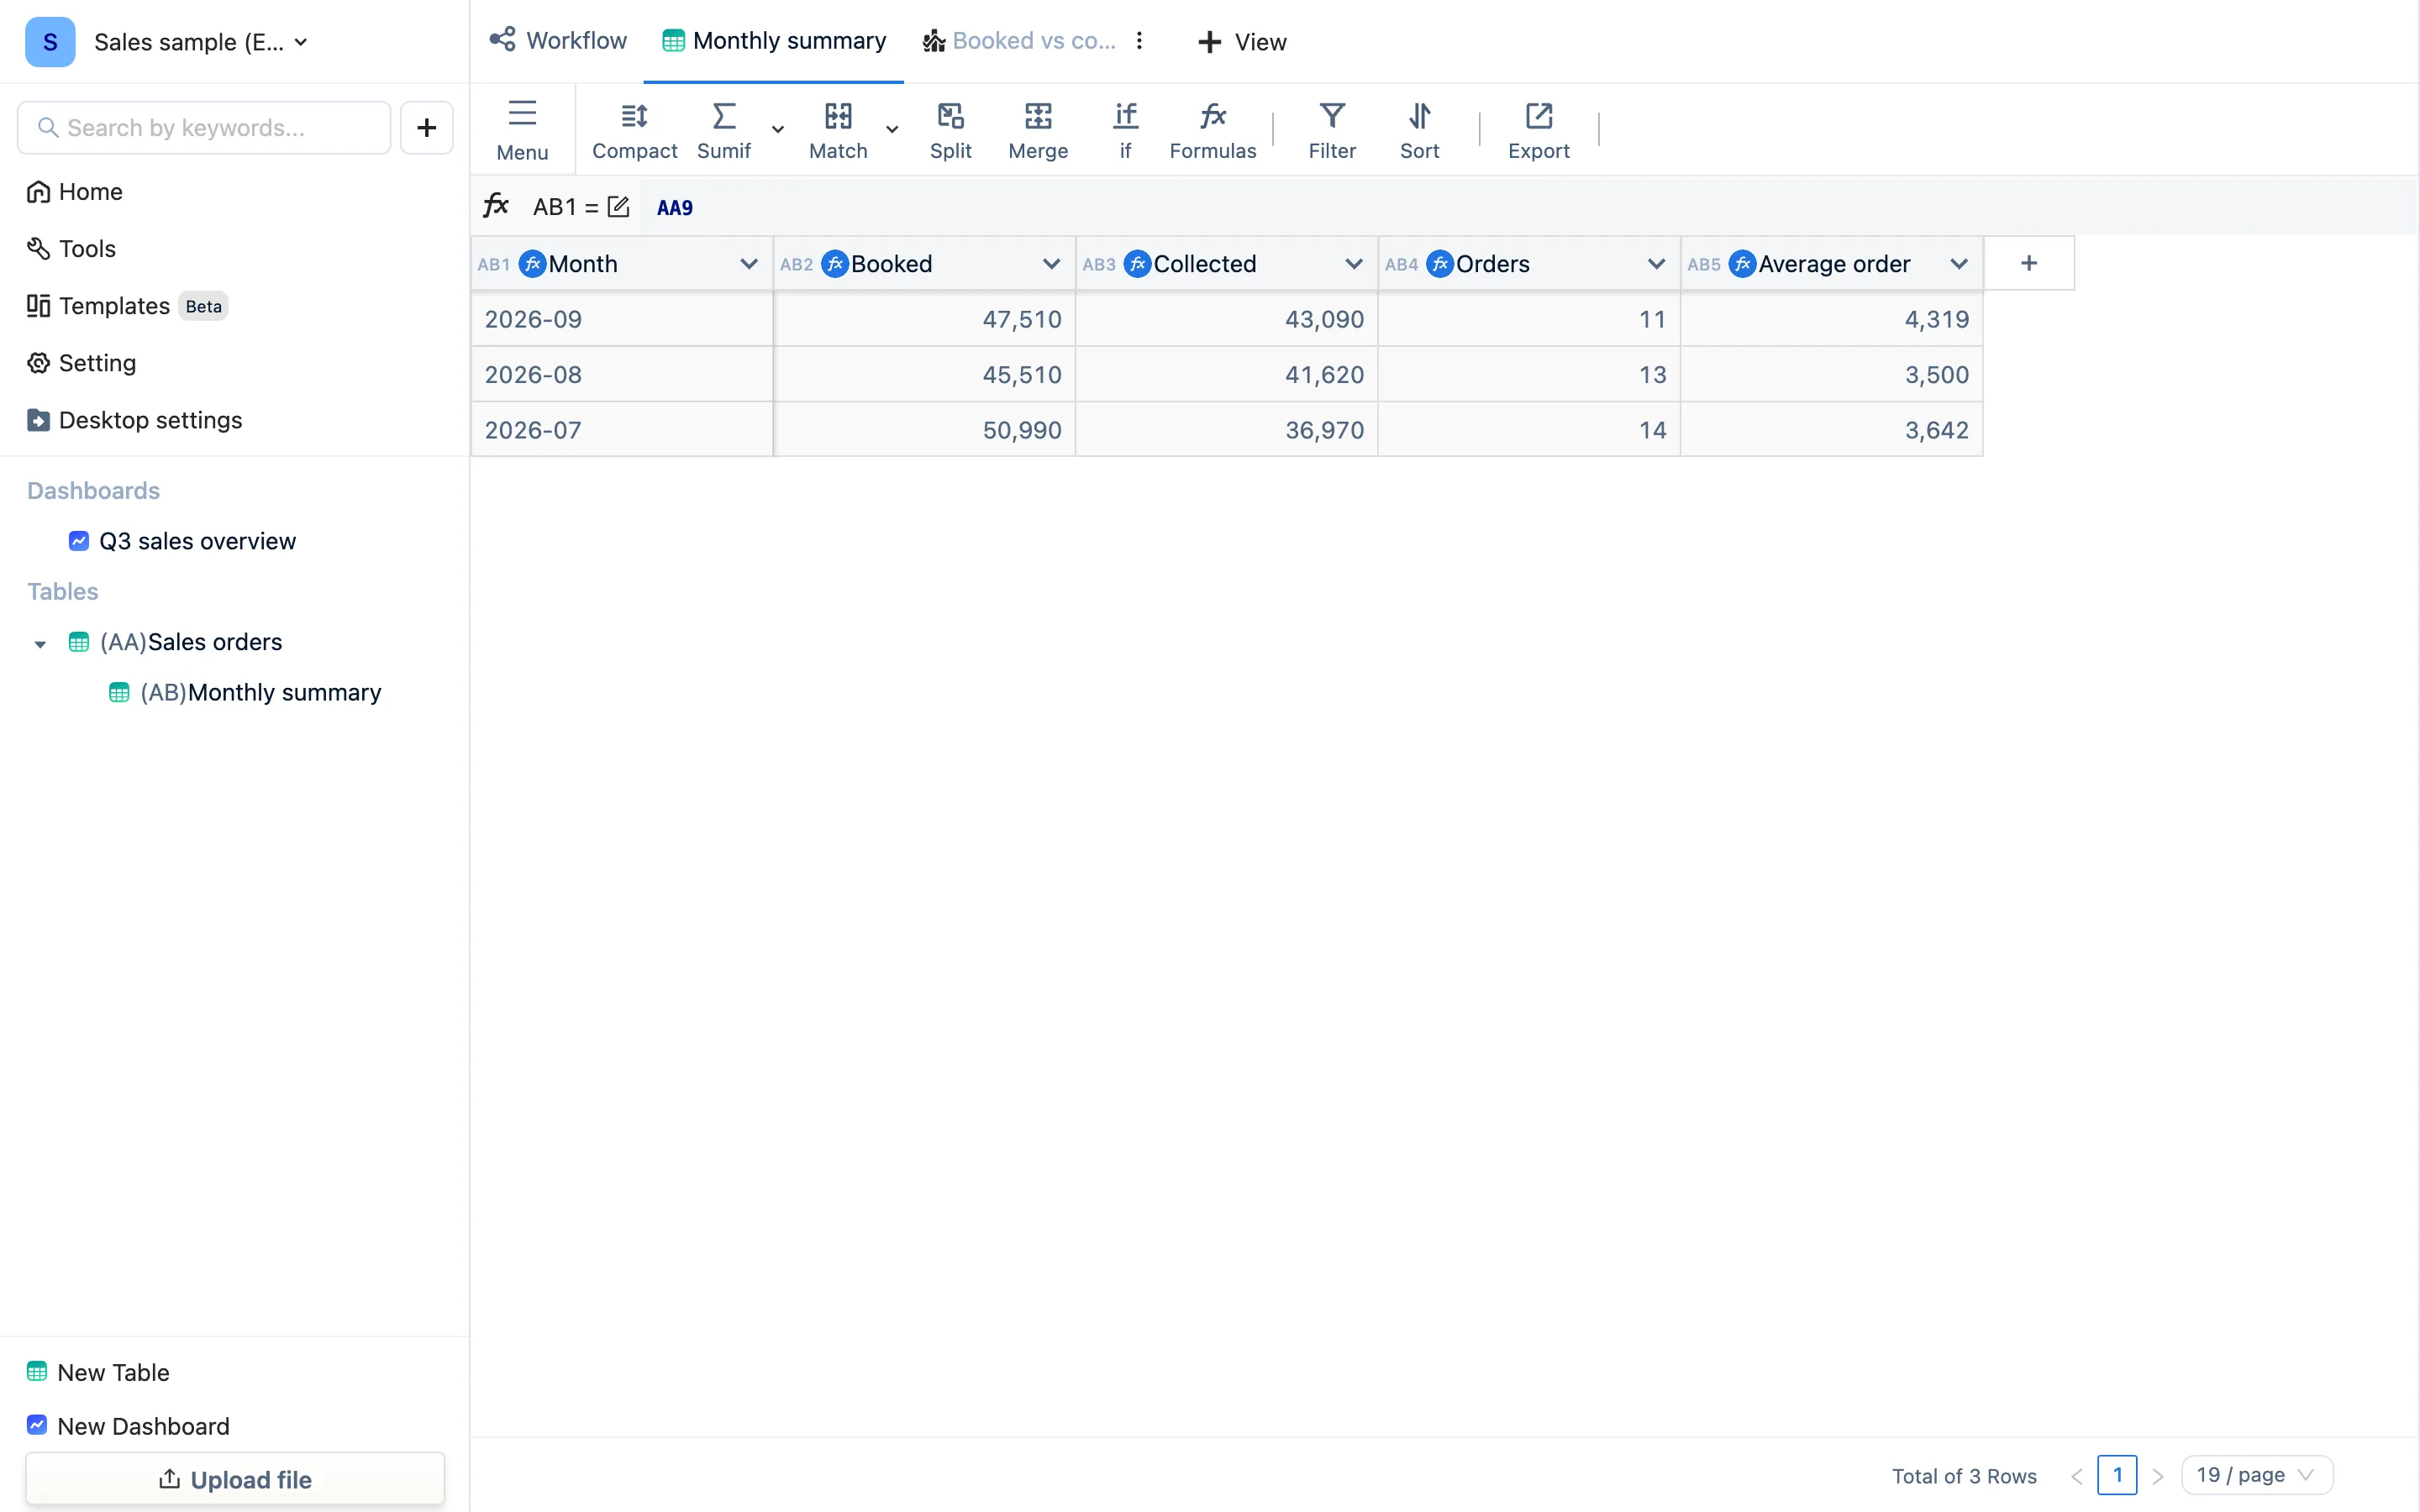
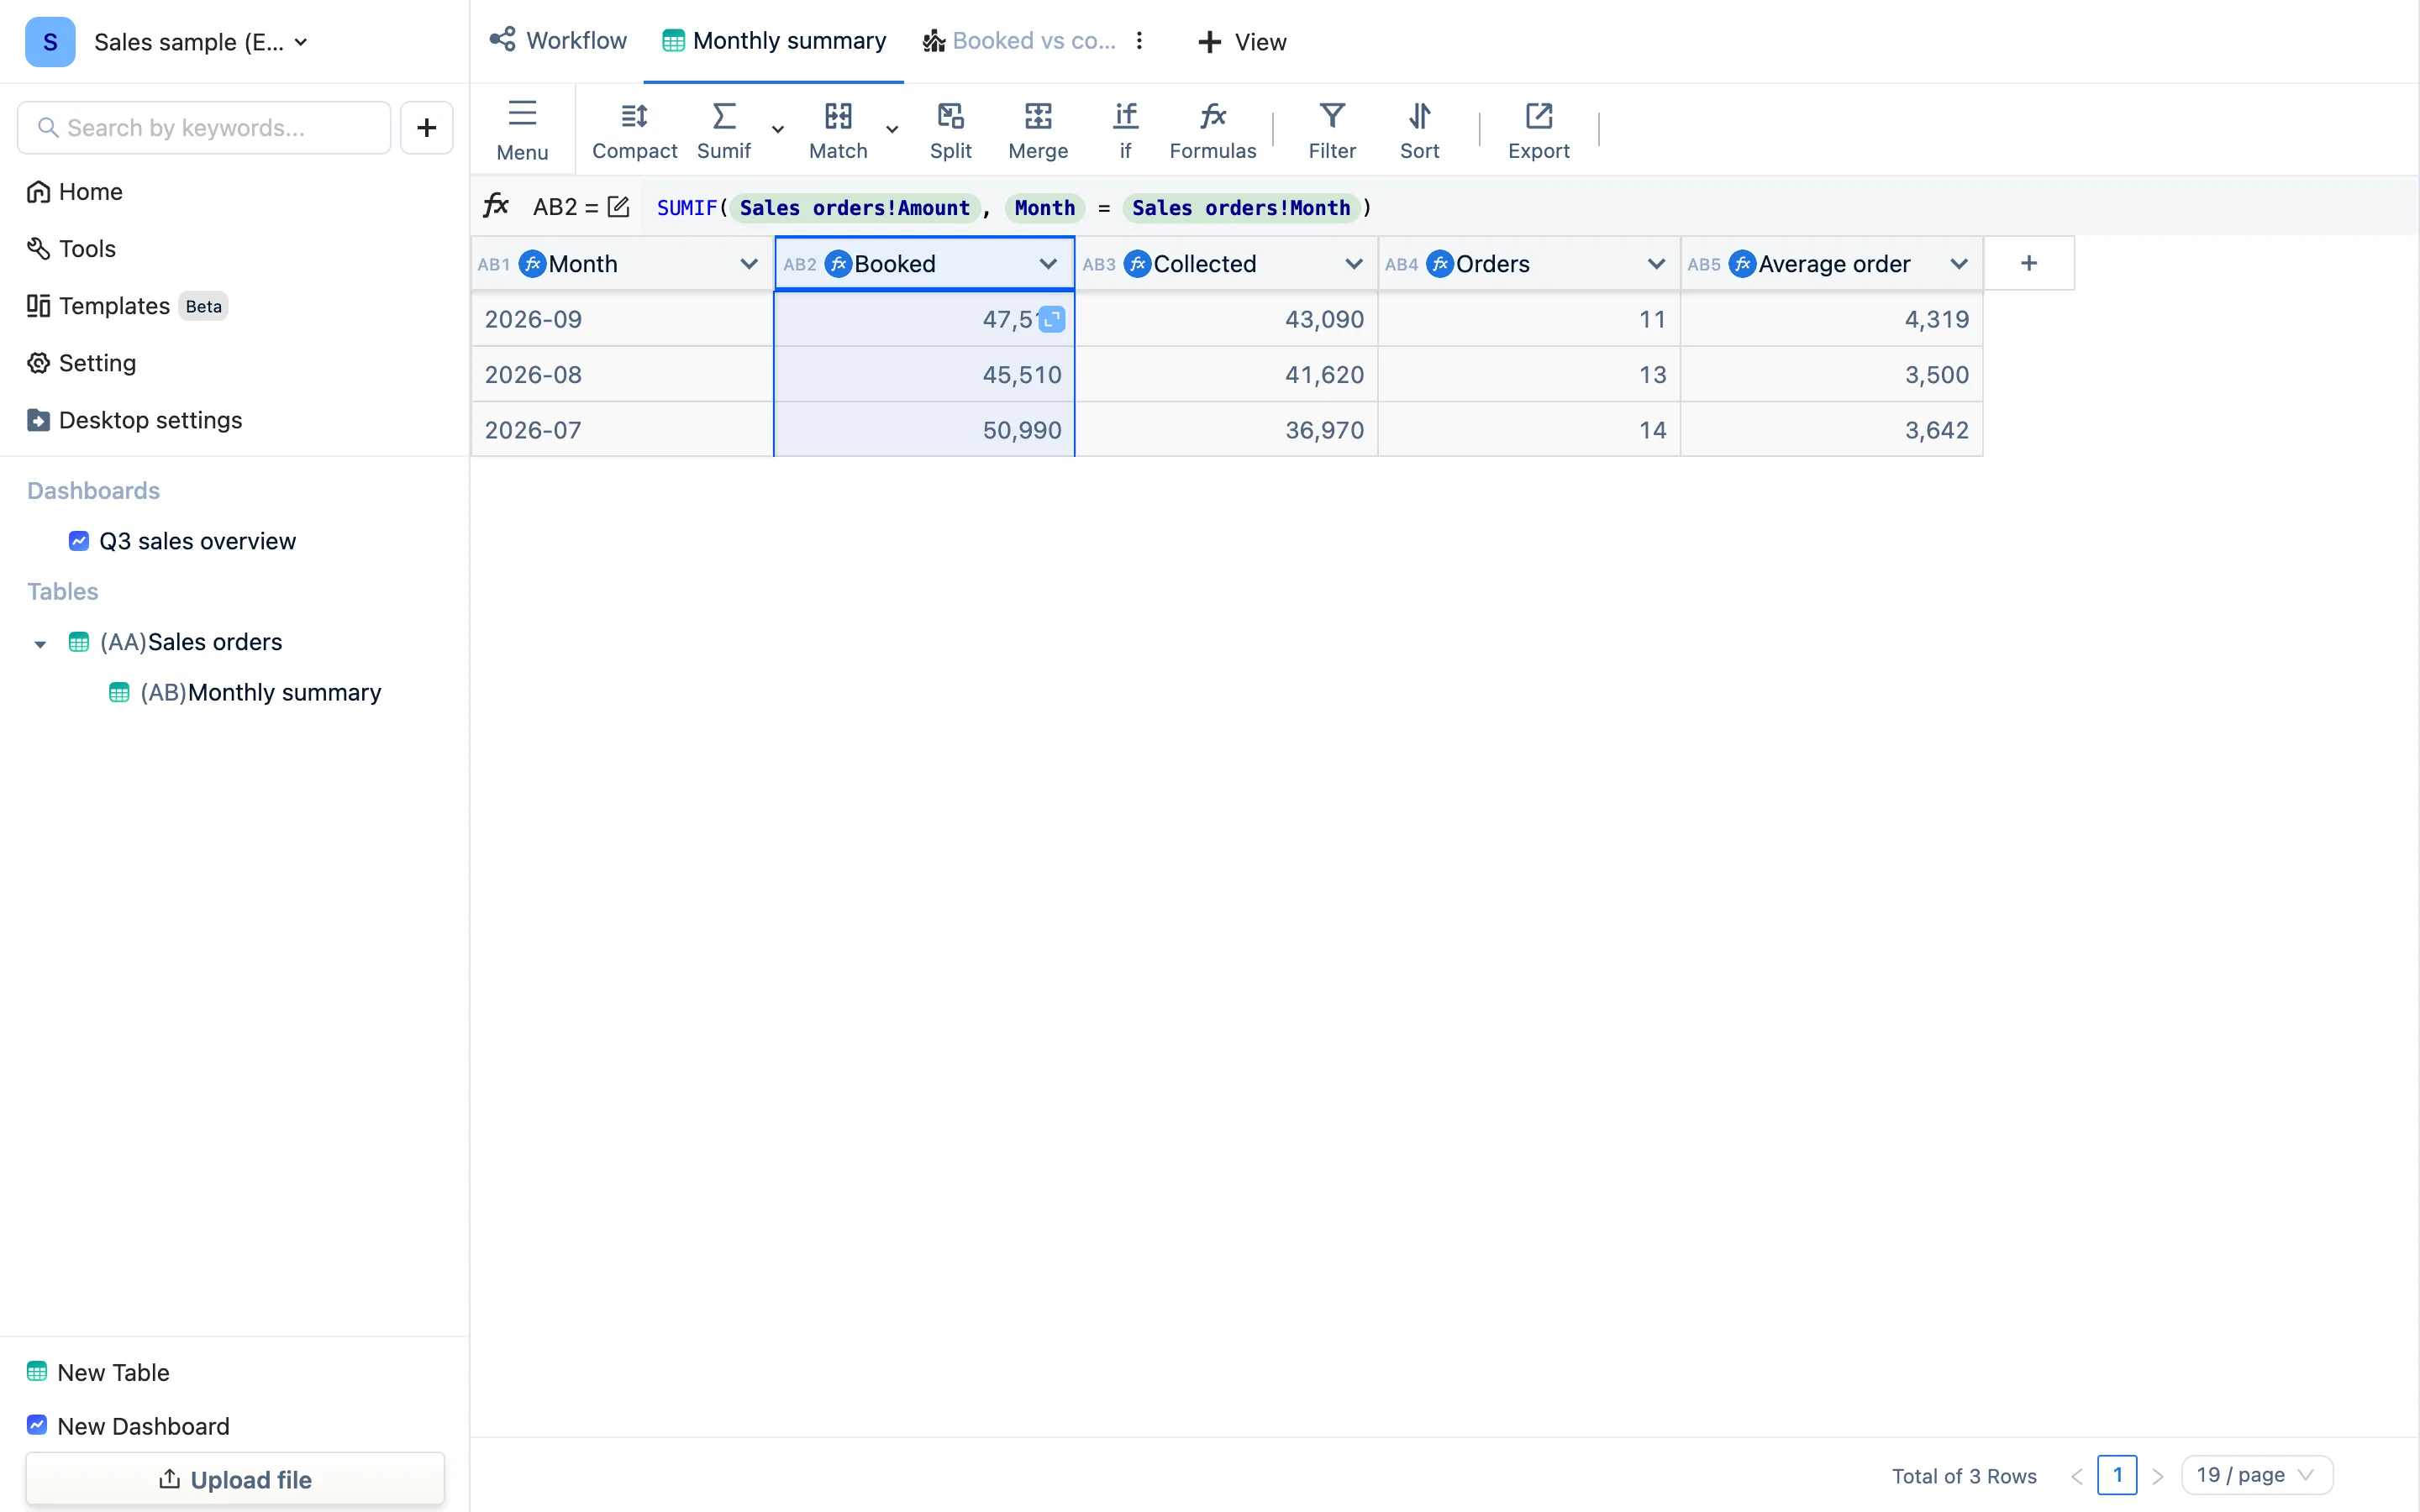
Next month's orders bring a 2026-10 row into existence on their own; change one amount and that month's total moves immediately.
The same thing from a panel
If you would rather not write it, the Sumif panel's Summarize mode does exactly this: choose the detail table, choose what to group by (Month), choose what to aggregate (Amount · Sum, Amount · Count), run, and you have a new table. See Summarize. The advantage of writing it by hand is that you can add a column or change a condition at any time.
Two grouping dimensions
For one row per month and region: referencing month in the first column and region in the second gives you the distinct values of each, not their combinations. Instead, add a column to the detail table with concat(AA9, "-", AA8) producing keys like 2026-09-EAST, reference that combined column in the summary's first column, and aggregate against it. Or use a pivot view, which handles two dimensions natively.
Summary table or pivot view?
| Summary table | Pivot view | |
|---|---|---|
| What it is | A real table | One way of looking at a table |
| Can take custom columns (average order, year on year) | Yes | No |
| Can be referenced by other tables, exported to Excel | Yes | Only screenshot or dashboard |
| Two dimensions, dragged around | Needs a combined key | Native |
| Suits | A definition you will reuse and build on | A quick look |
A note on primary keys
The grouping values in a summary's first column are its natural unique key. If the grouping column is itself a formula column, the incremental xsumif / xcountif variants require the primary key not to be a formula; plain sumif has no such restriction. Day to day, sumif is the right choice.